Assignment 04: Mapping Proximity and Concentration
In this assignment you will work with two new geographic concepts: proximity and concentration.
You will be introduced to multiple analytical methods through a series of examples related to the geographies of contaminated sites in Newark and surrounding counties. Building on skills encountered in Assignment 03 you will add additional analytical methods to your arsenal. As this is the last weekly assignment of the semester you will be required to execute skills covered in previous assignments on your own with fewer step by step instructions.
Deliverables
Upload answers to numbered questions (these appear throughout the text and are reproduced here) and your map composition that follows requirements described in the “Symbology & Map Composition” section to canvas by 11/4.
Questions:
Part A:
- What are the linear units of the census tract layer?
- Why does the formula divide the area given by the geometry of the data layer by 43560? (hint: this is related to converting from the units of the census tract layer to acres)
- In your own words, what is the Modifiable Areal Unit Problem? And how is it relevant to the density maps you have produced here?
Part B:
- How many buildings are within 1/4 mile on the ground walking distance of the Diamond Alkali Company superfund site?
For part A map, please follow the instructions in the “Symbology & Map Composition” section. For part B please upload a screenshot of the results of your shortest path analysis (this does not need to be a designed map composition but should show the shortest path routes clearly).
Text responses should be saved as a .txt file, and maps as .pdf, .jpg, or .png files. Use the naming convention:
lastname_firstname_assignment04
Data download
Before you begin download the required data from the course Google Drive Folder here
Part A: Density of Contaminated sites
In part A you will use three different methods for calculating the density of Known Contaminated Sites in Newark and surrounding counties:
- Density of sites by census block for Newark
- Density of sites by census tract for Newark
- Kernel density for sites in Essex, Union, and Hudson Counties
In conducting this comparison you will experience first hand the impacts of the modifiable areal unit problem discussed in class.
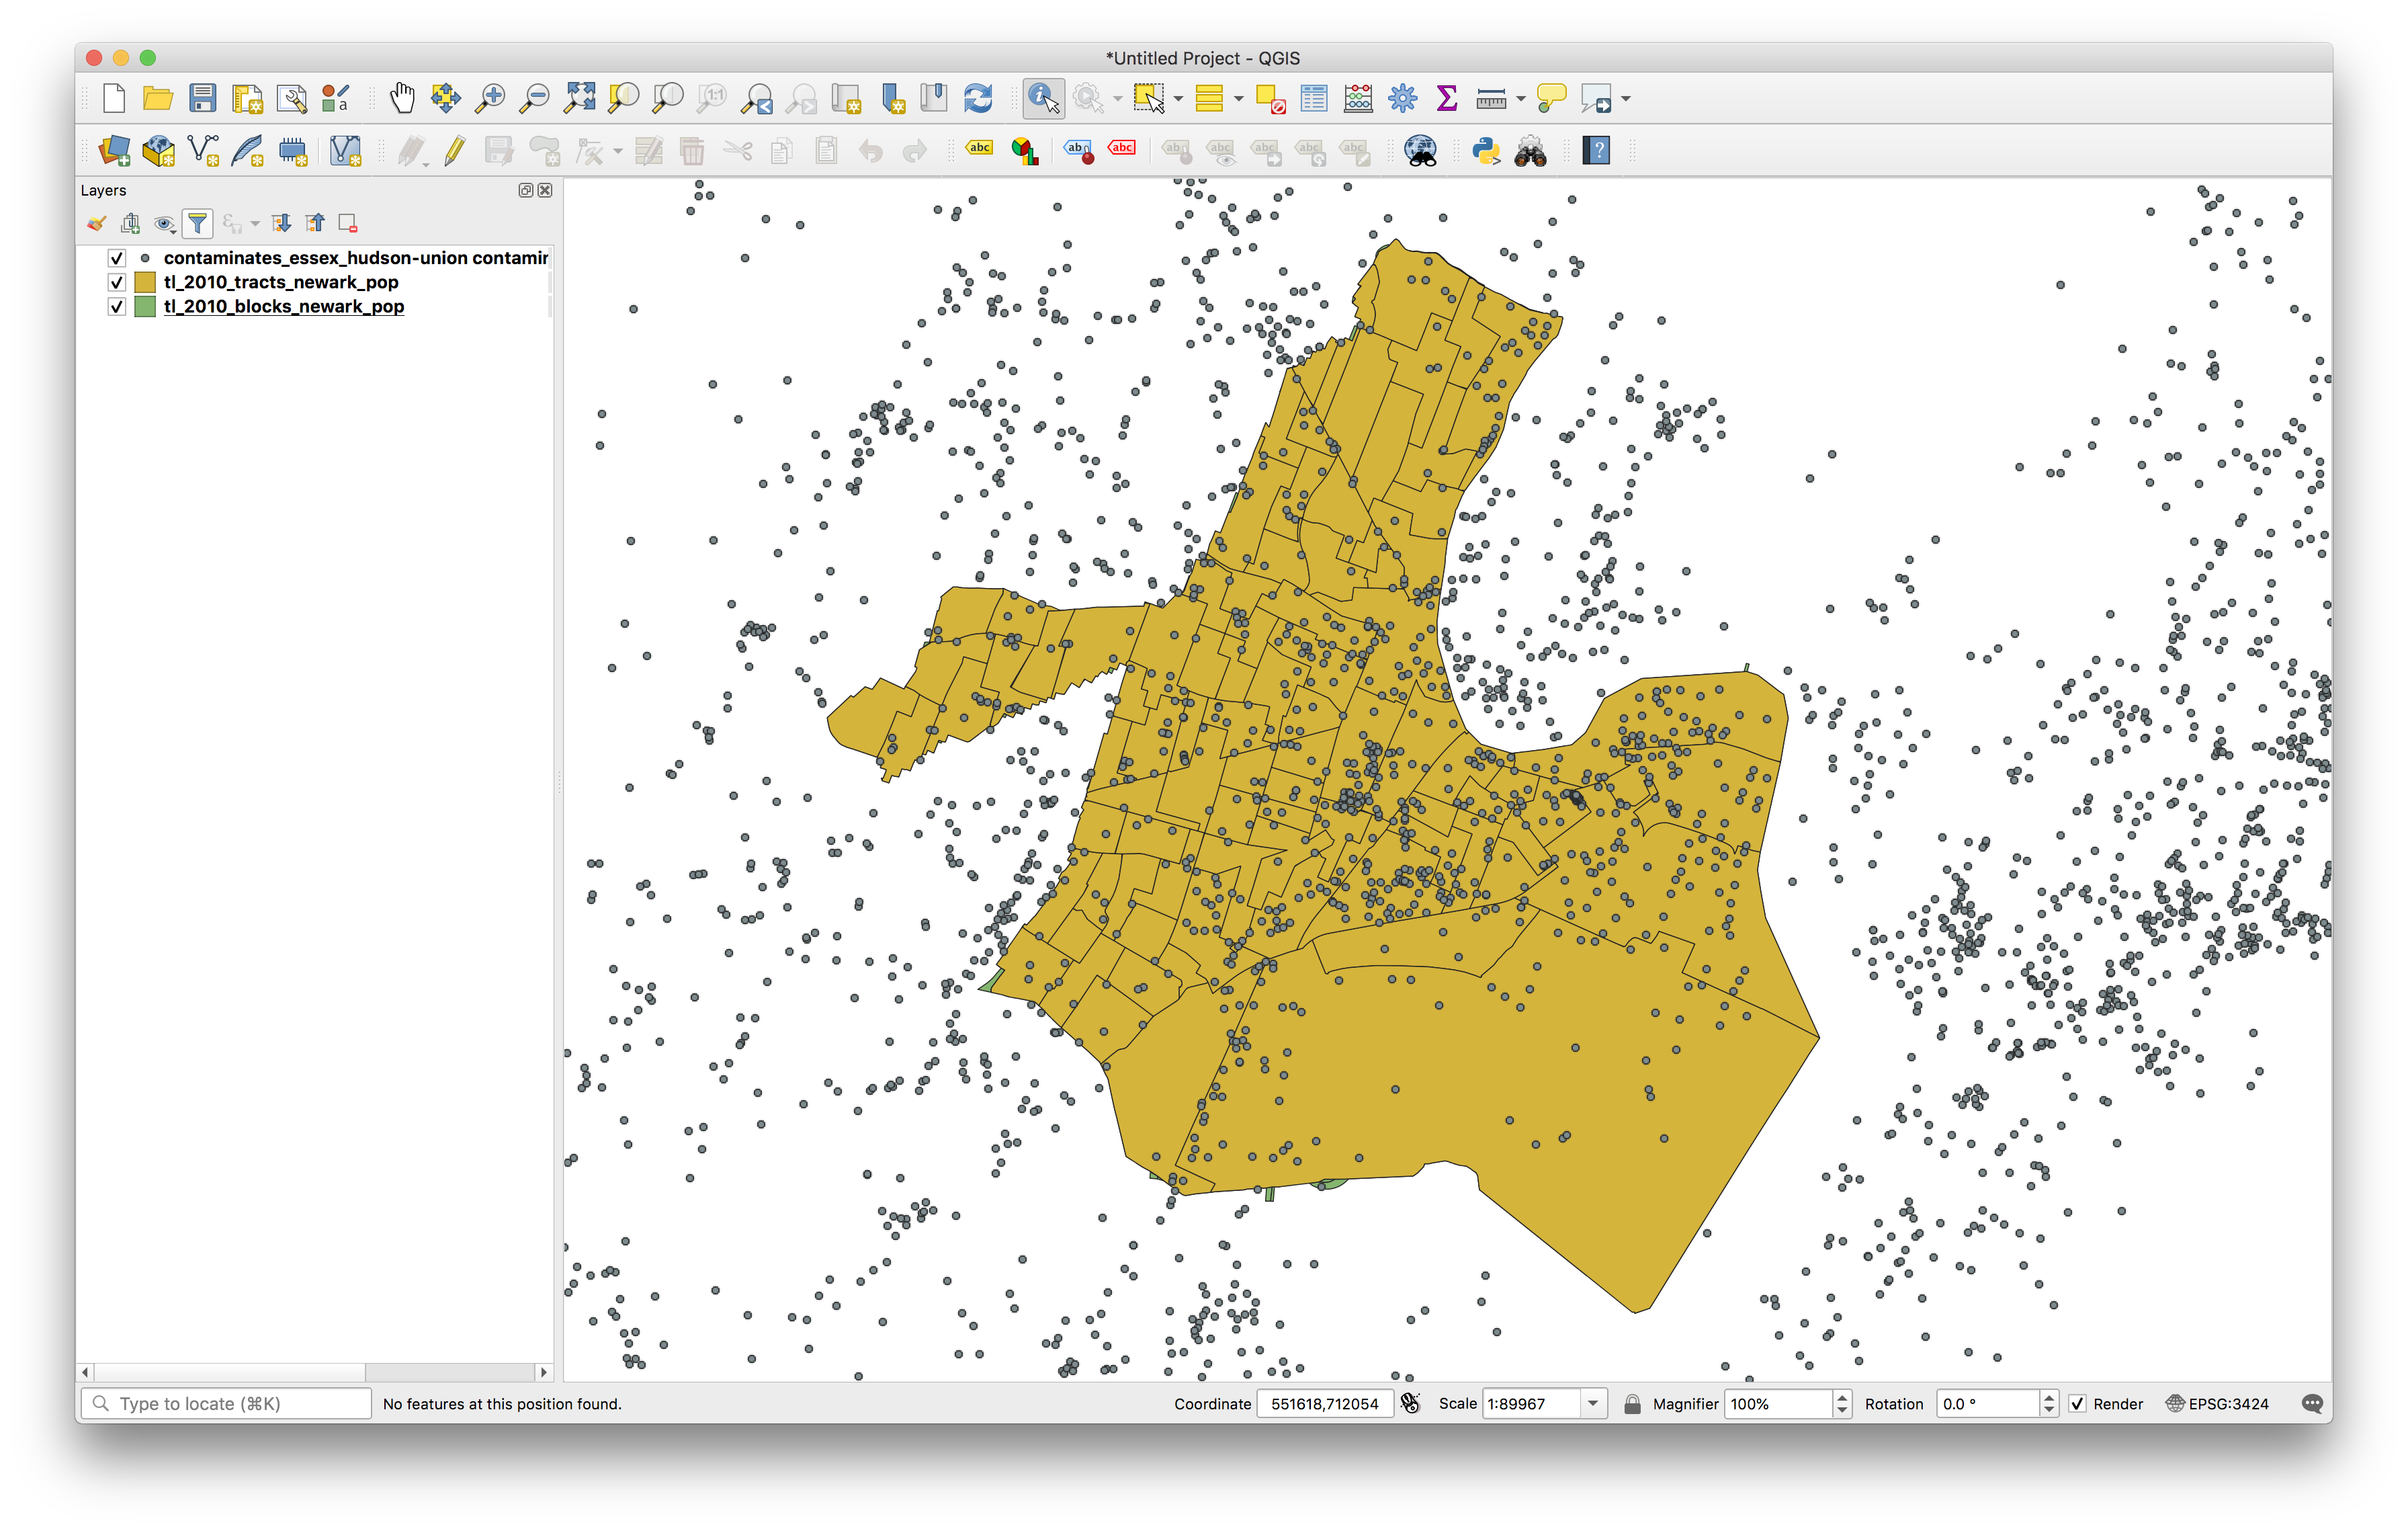
Add the datasets that will be used for part A of this assignment:
- Known contaminated sites from NJ DEP. (Please familiarize yourself with this dataset by viewing its metadata here)
- Census tracts with population information join for Newark
- Census blocks with population information join for Newark
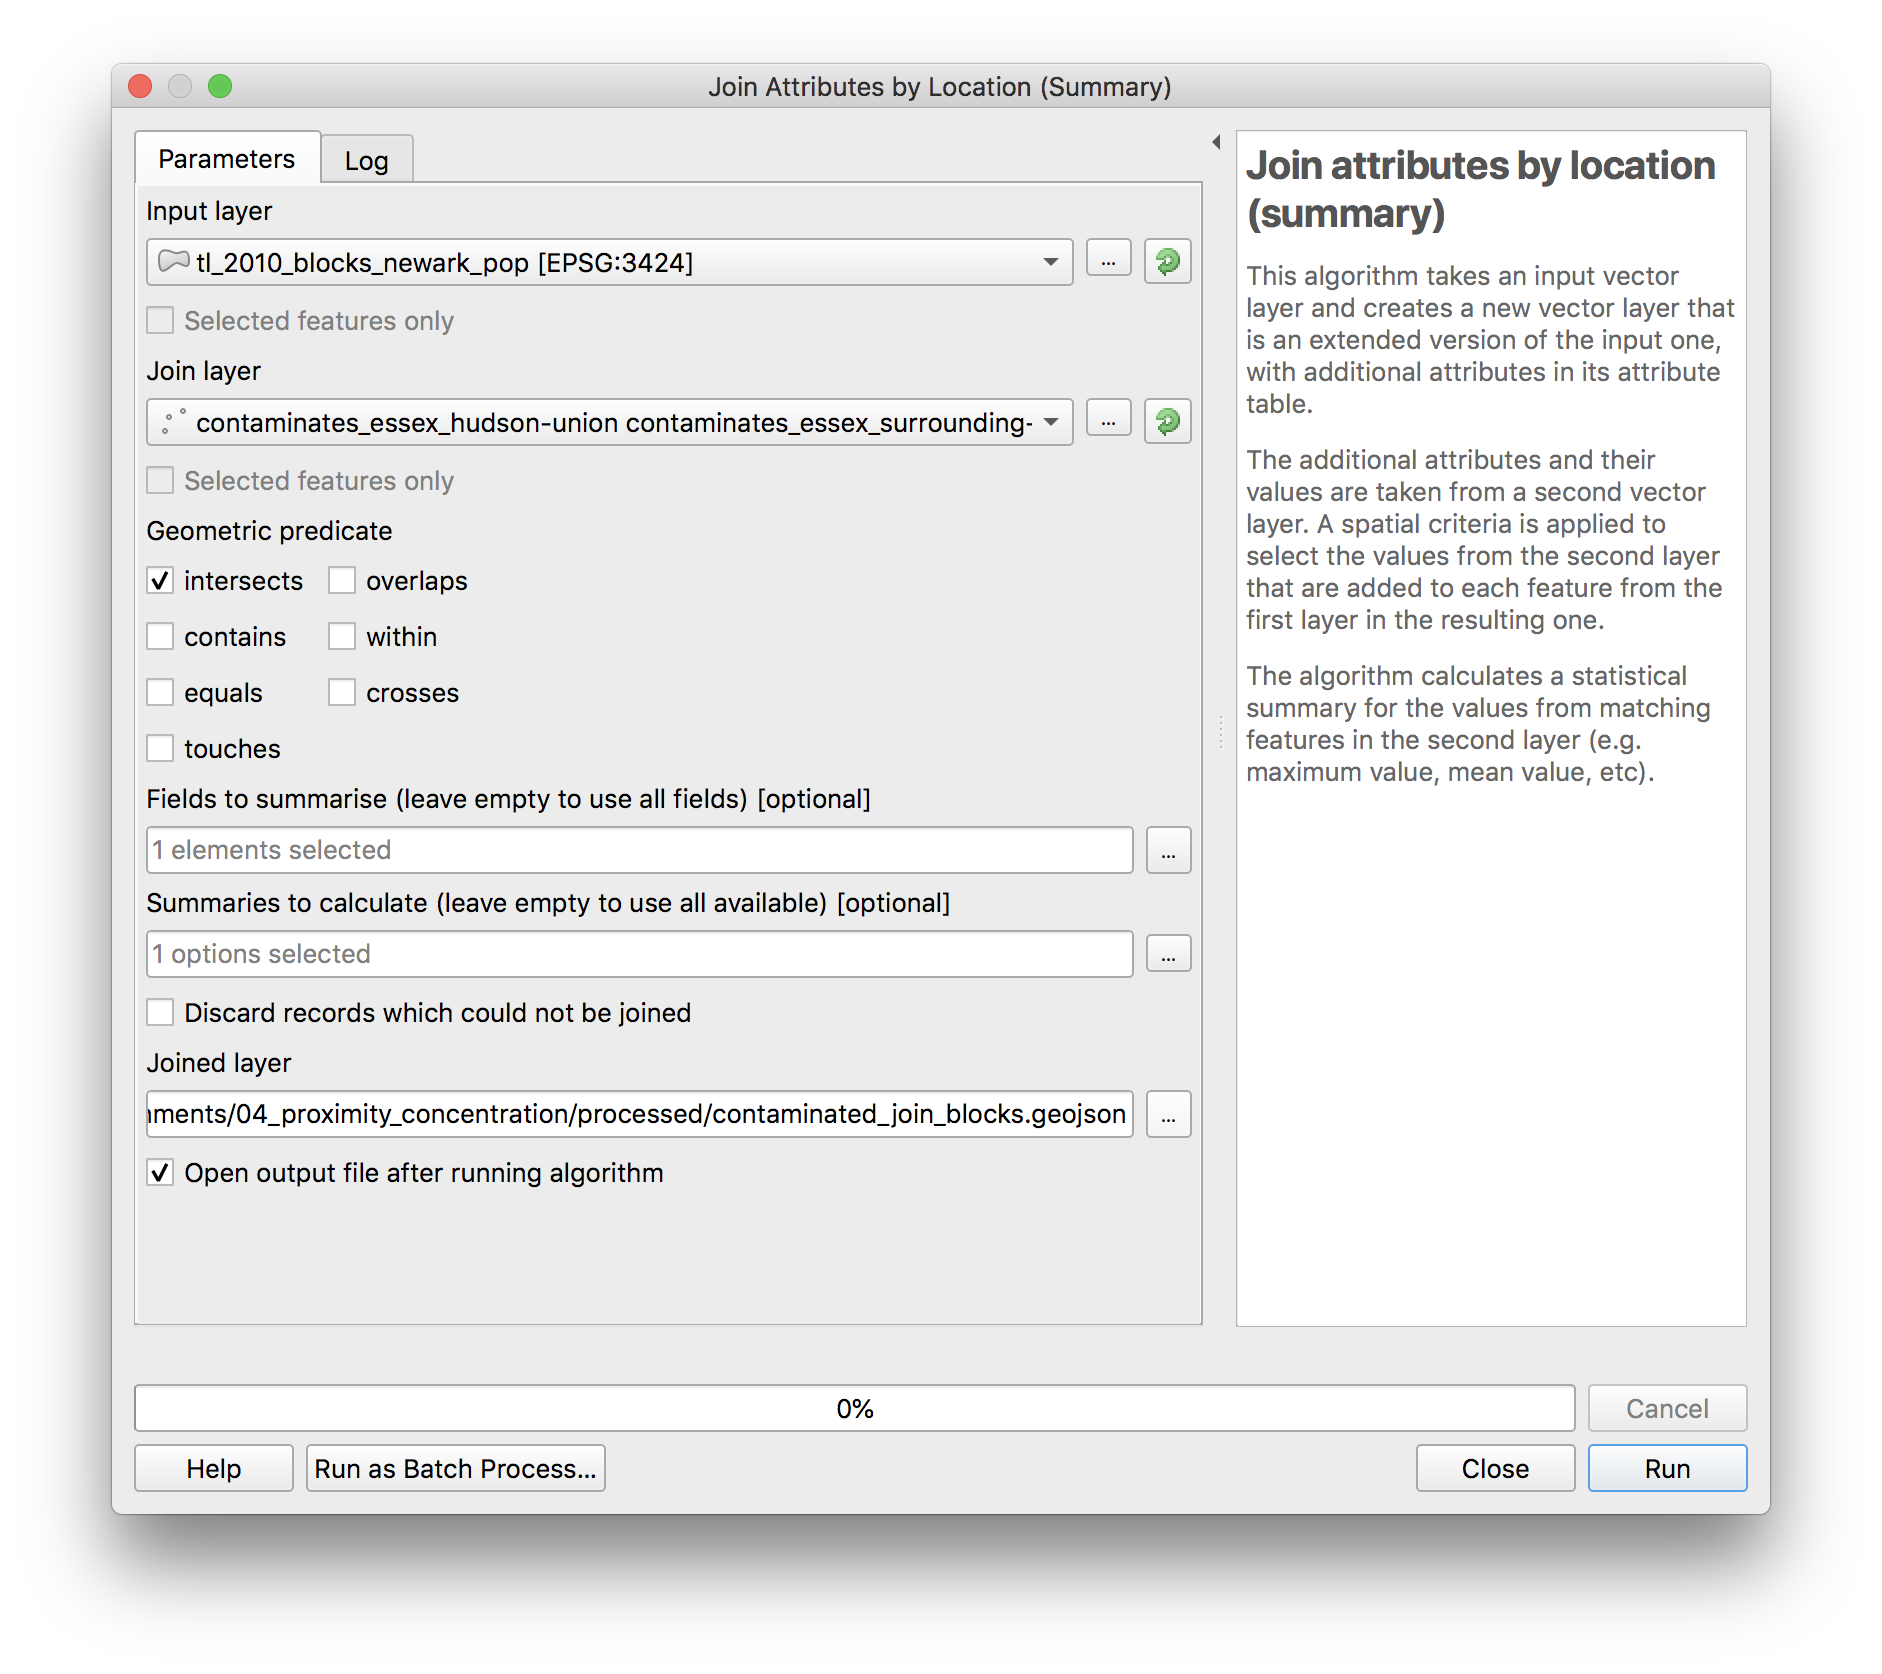
Use a spatial join to count the number of known contaminated sites within each census block. Remember from assignment 3: if we are joining information from the contaminated sites to the census blocks, then the input layer is census blocks and the join layer is contaminated sites. The tool name (remember from assignment 3) is Join attributes by location (summary) and you can access the tool via the Processing Toolbox. Select OBJECTID as the field to summarize and count as the summary to calculate. Create a new folder you create within the data folder for this assignment called processed, save the joined layer as contaminated_join_blocks.geojson.
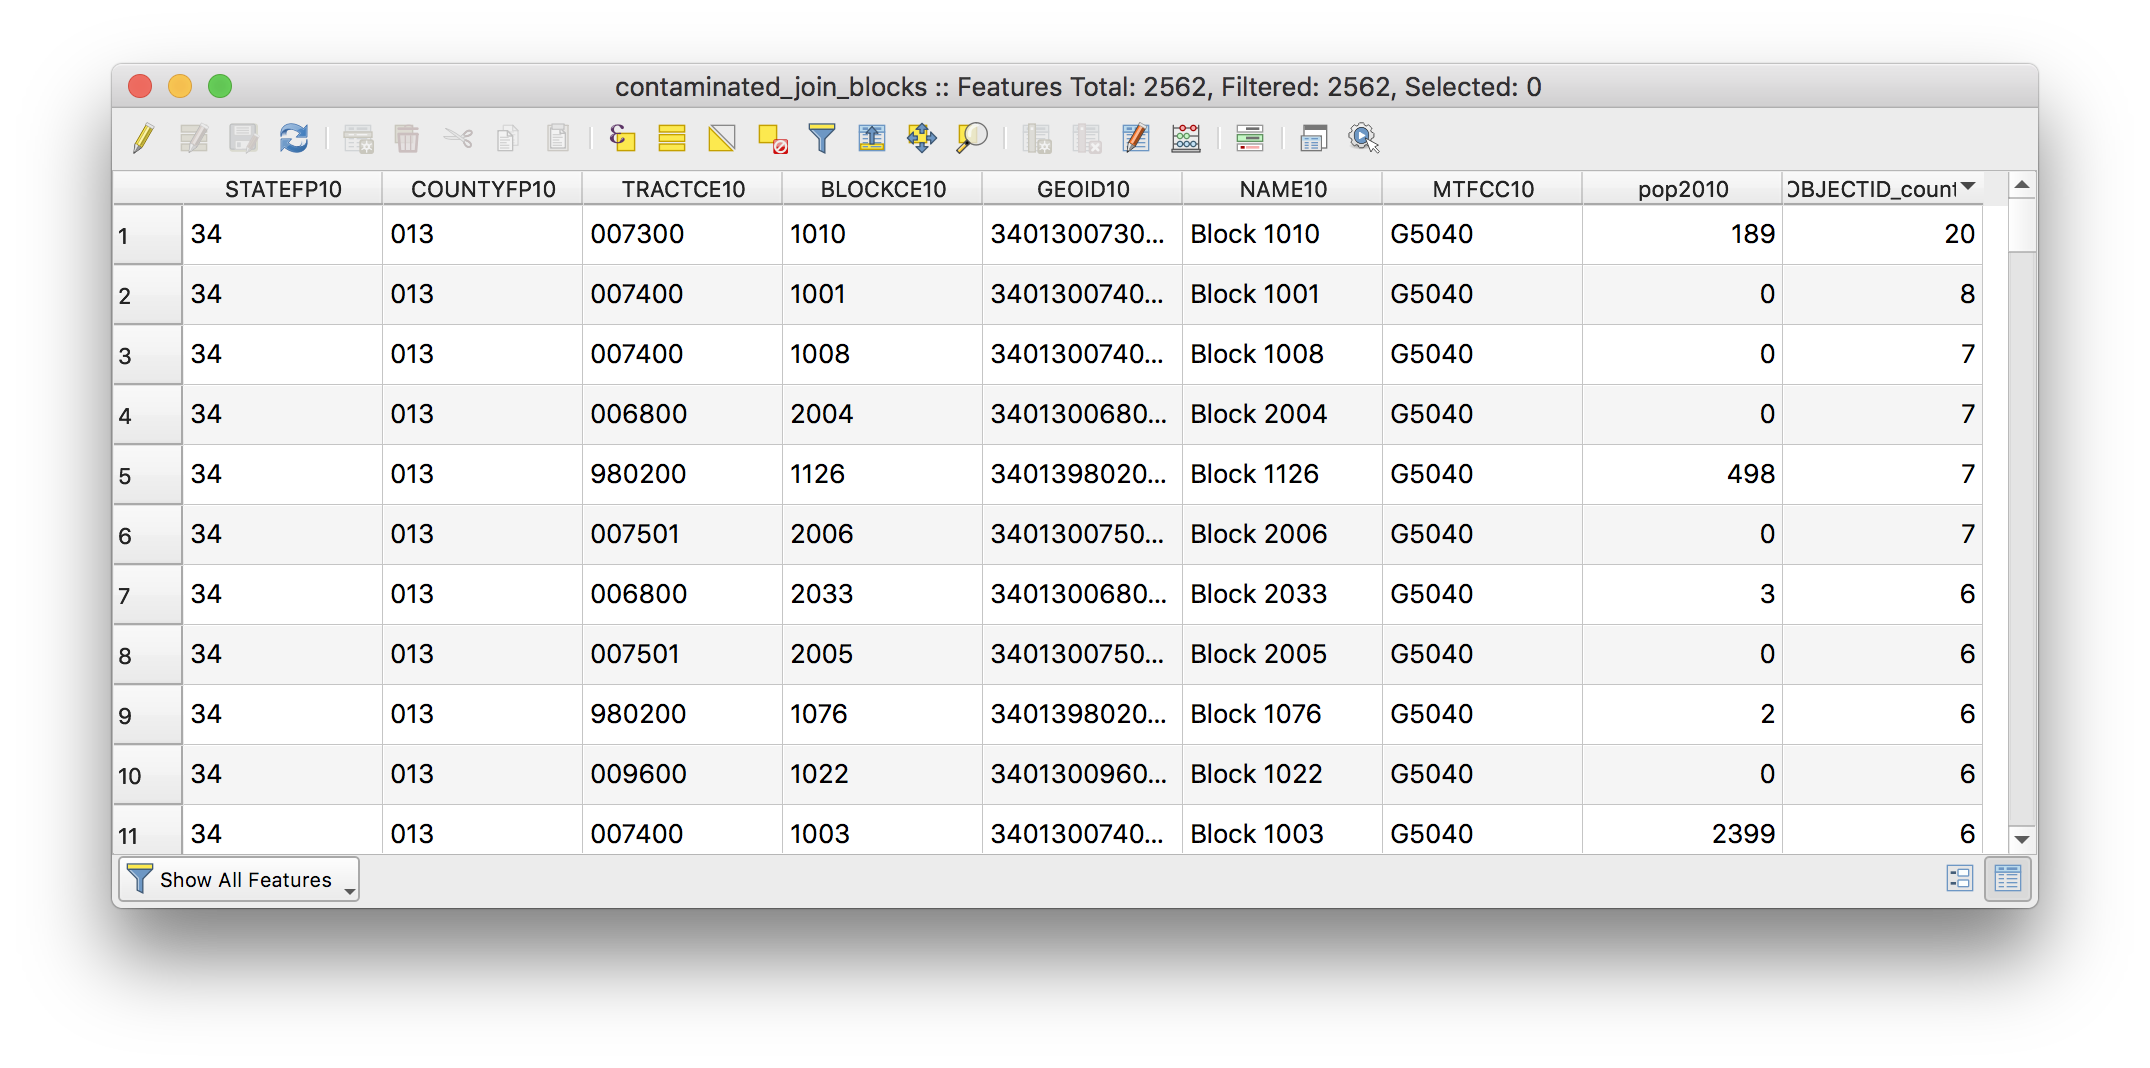
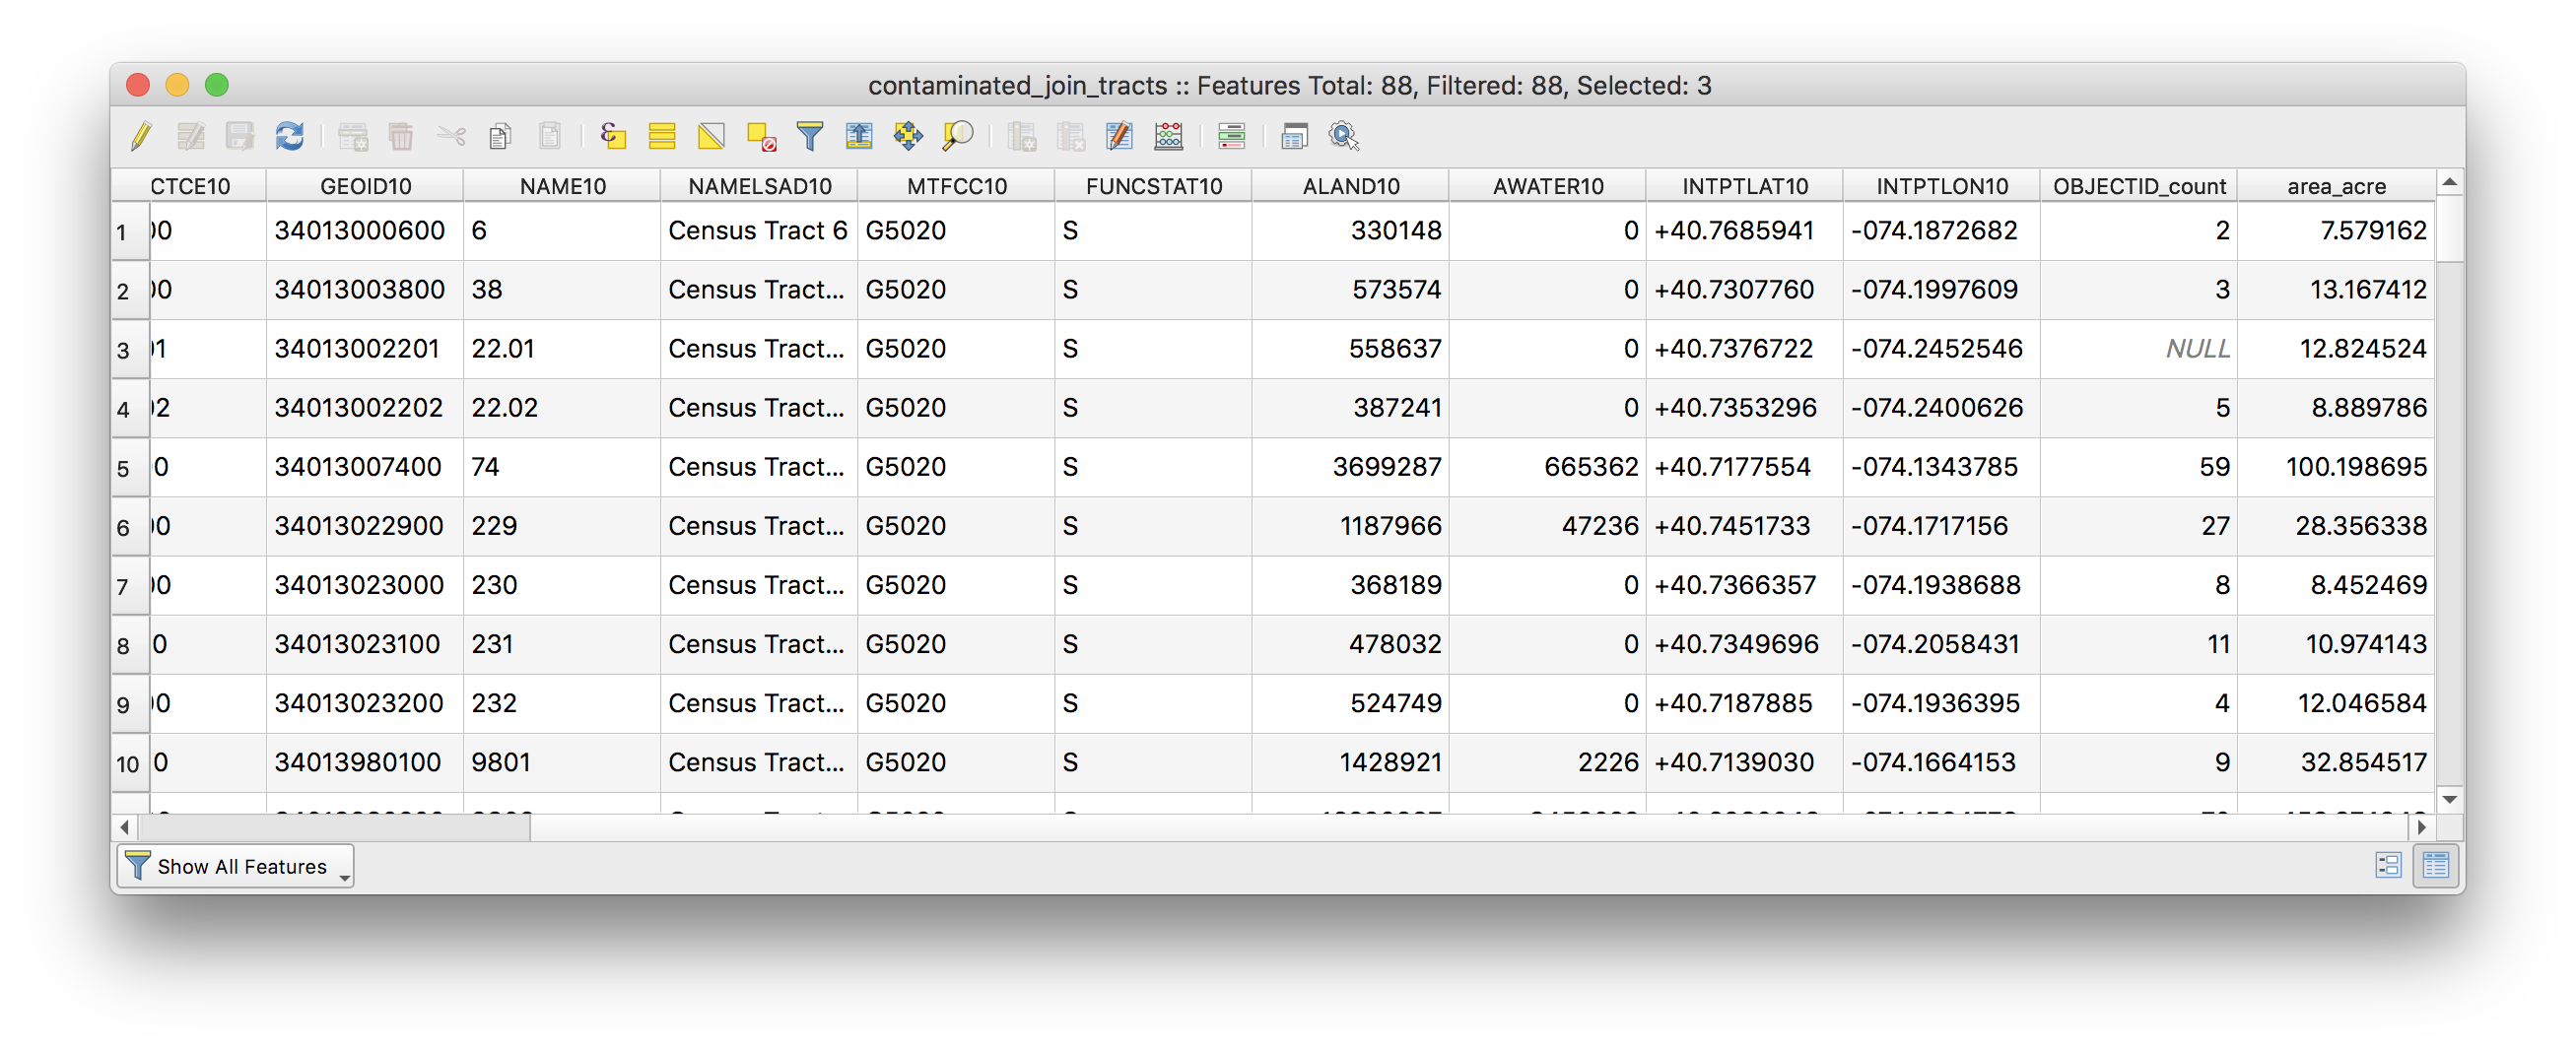
Once the new layer is added to your map check the attribute table to be sure that the spatial join was successful (you can sort by OBJECTID_count field by clicking on it to see which block has the most sites).
Repeat the same steps above but for the census tracts. Save this join layer as save the joined layer as contaminated_join_tracts.geojson.
Remove the original tract (tl_2010_tracts_newark_pop) and block layers (tl_2010_blocks_newark_pop) from your map project to keep things organized.
Calculate area and density
Use the field calculator to add a new field that contains the area of each census tract in acres.
- What are the linear units of the census tract layer?
- Why does the formula divide the area given by the geometry of the data layer by 43560? (hint: this is related to converting from the units of the census tract layer to acres)
- In your own words, what is the Modifiable Areal Unit Problem? And how is it relevant to the density maps you have produced here?
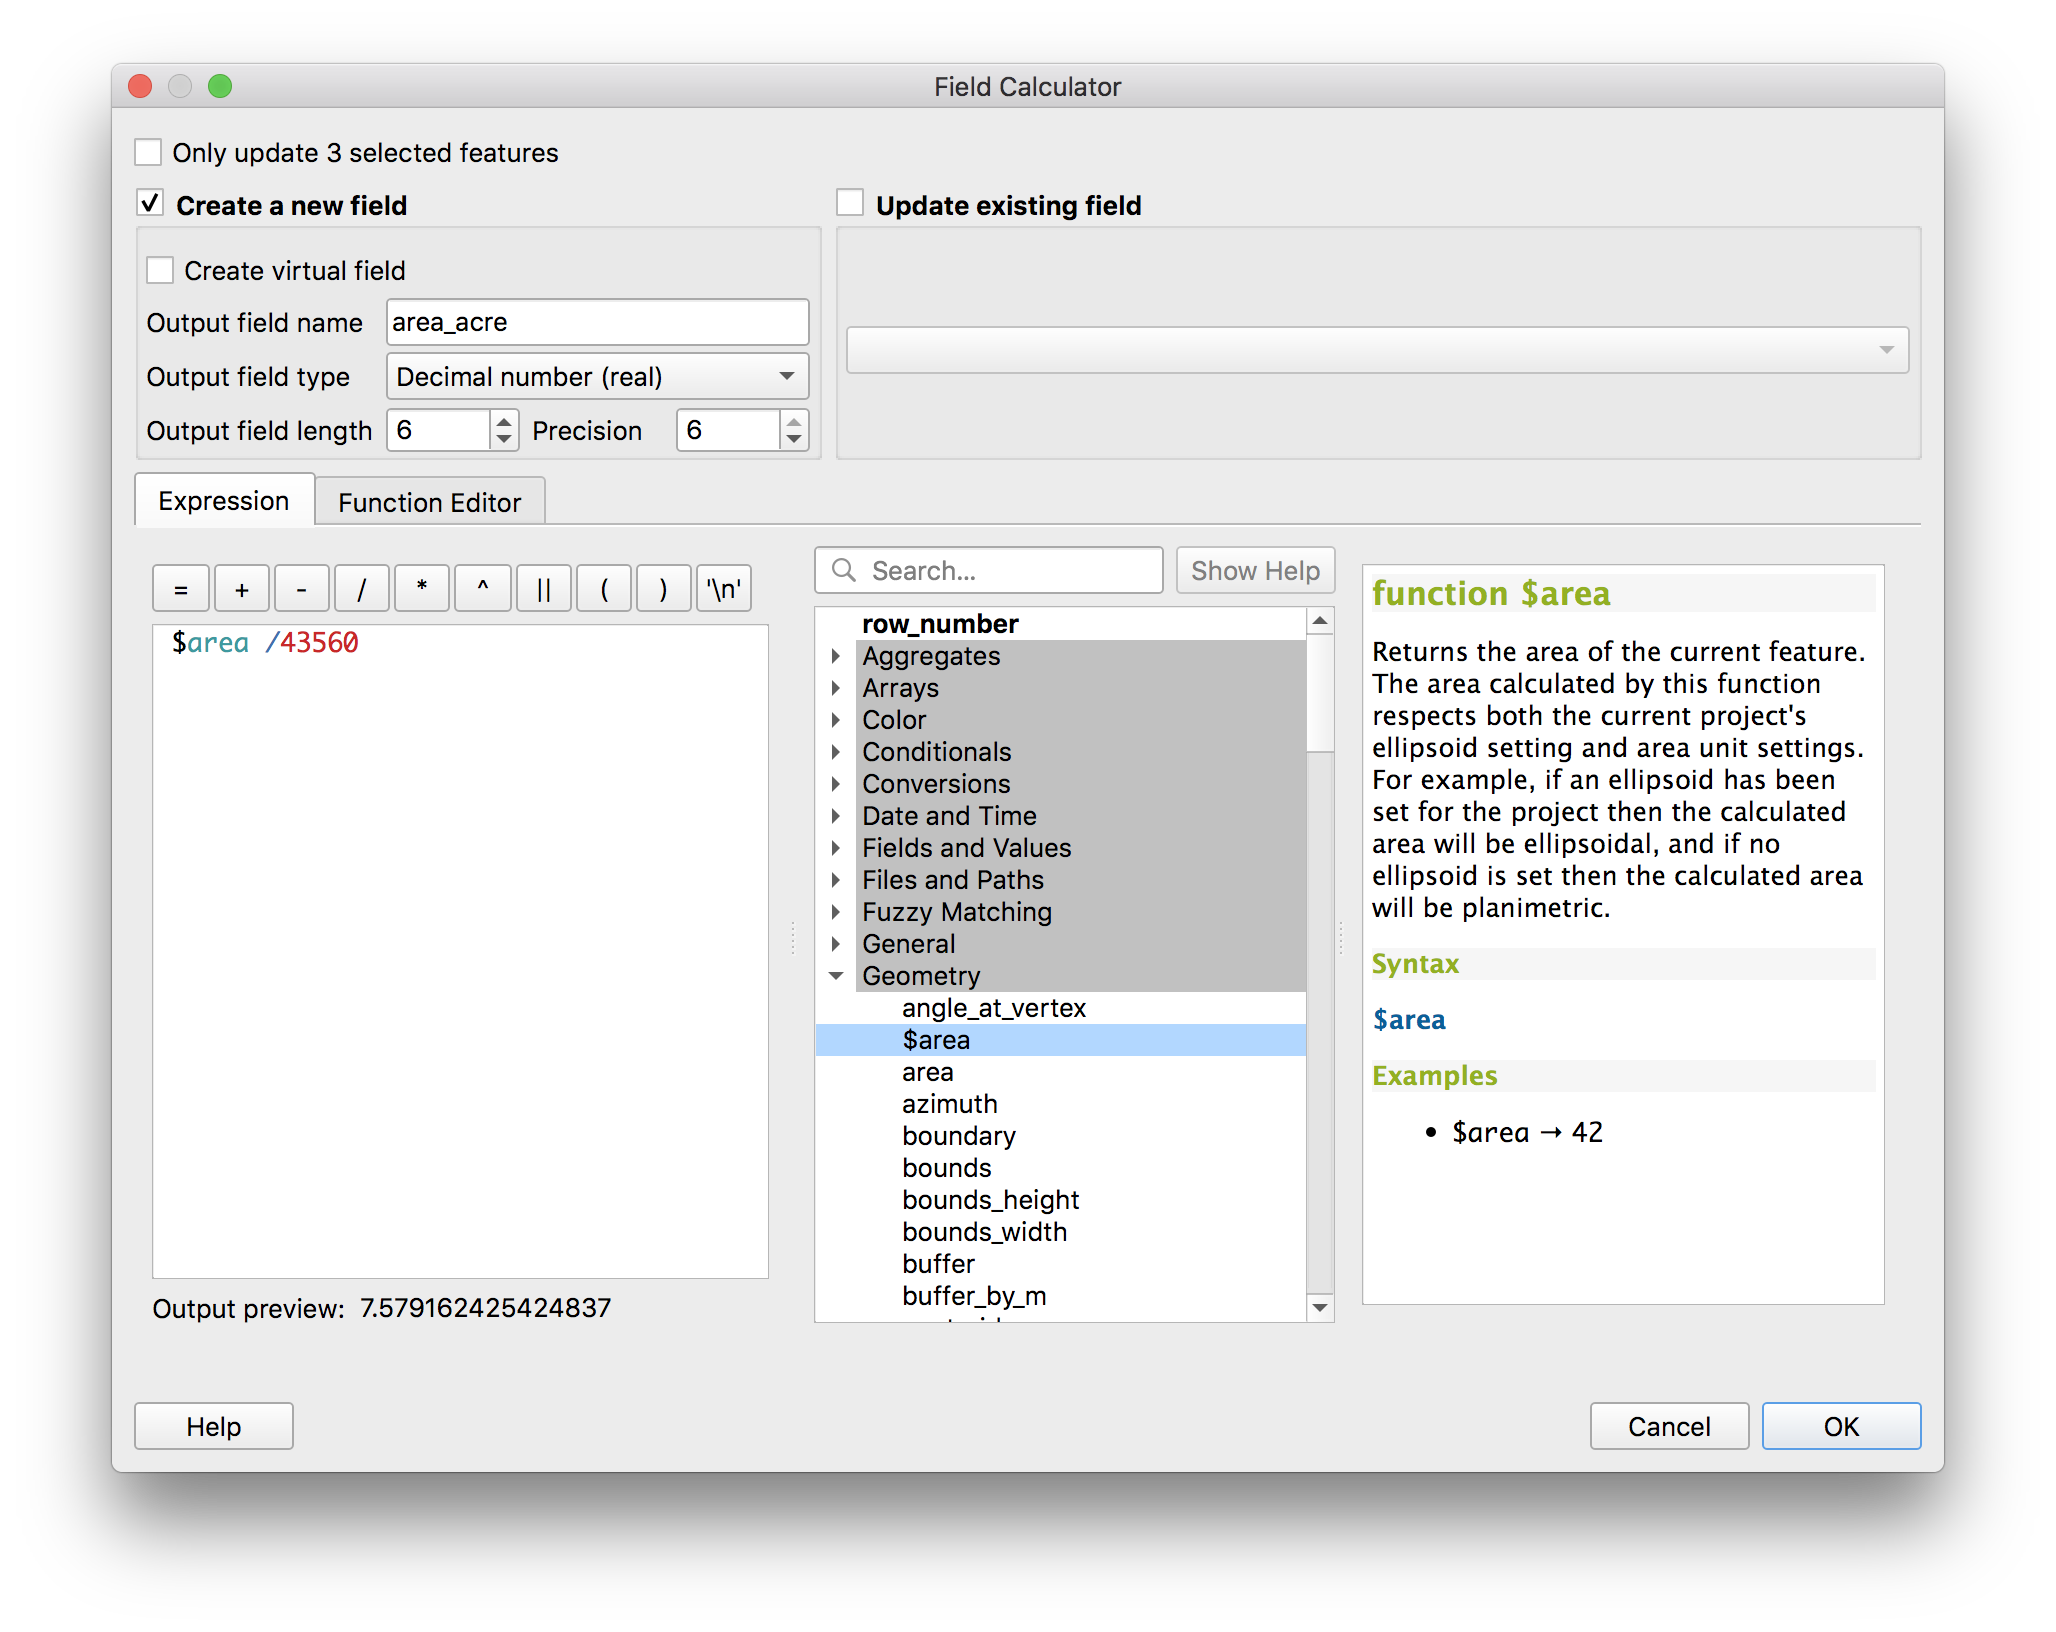
The attribute table should have a new column added:
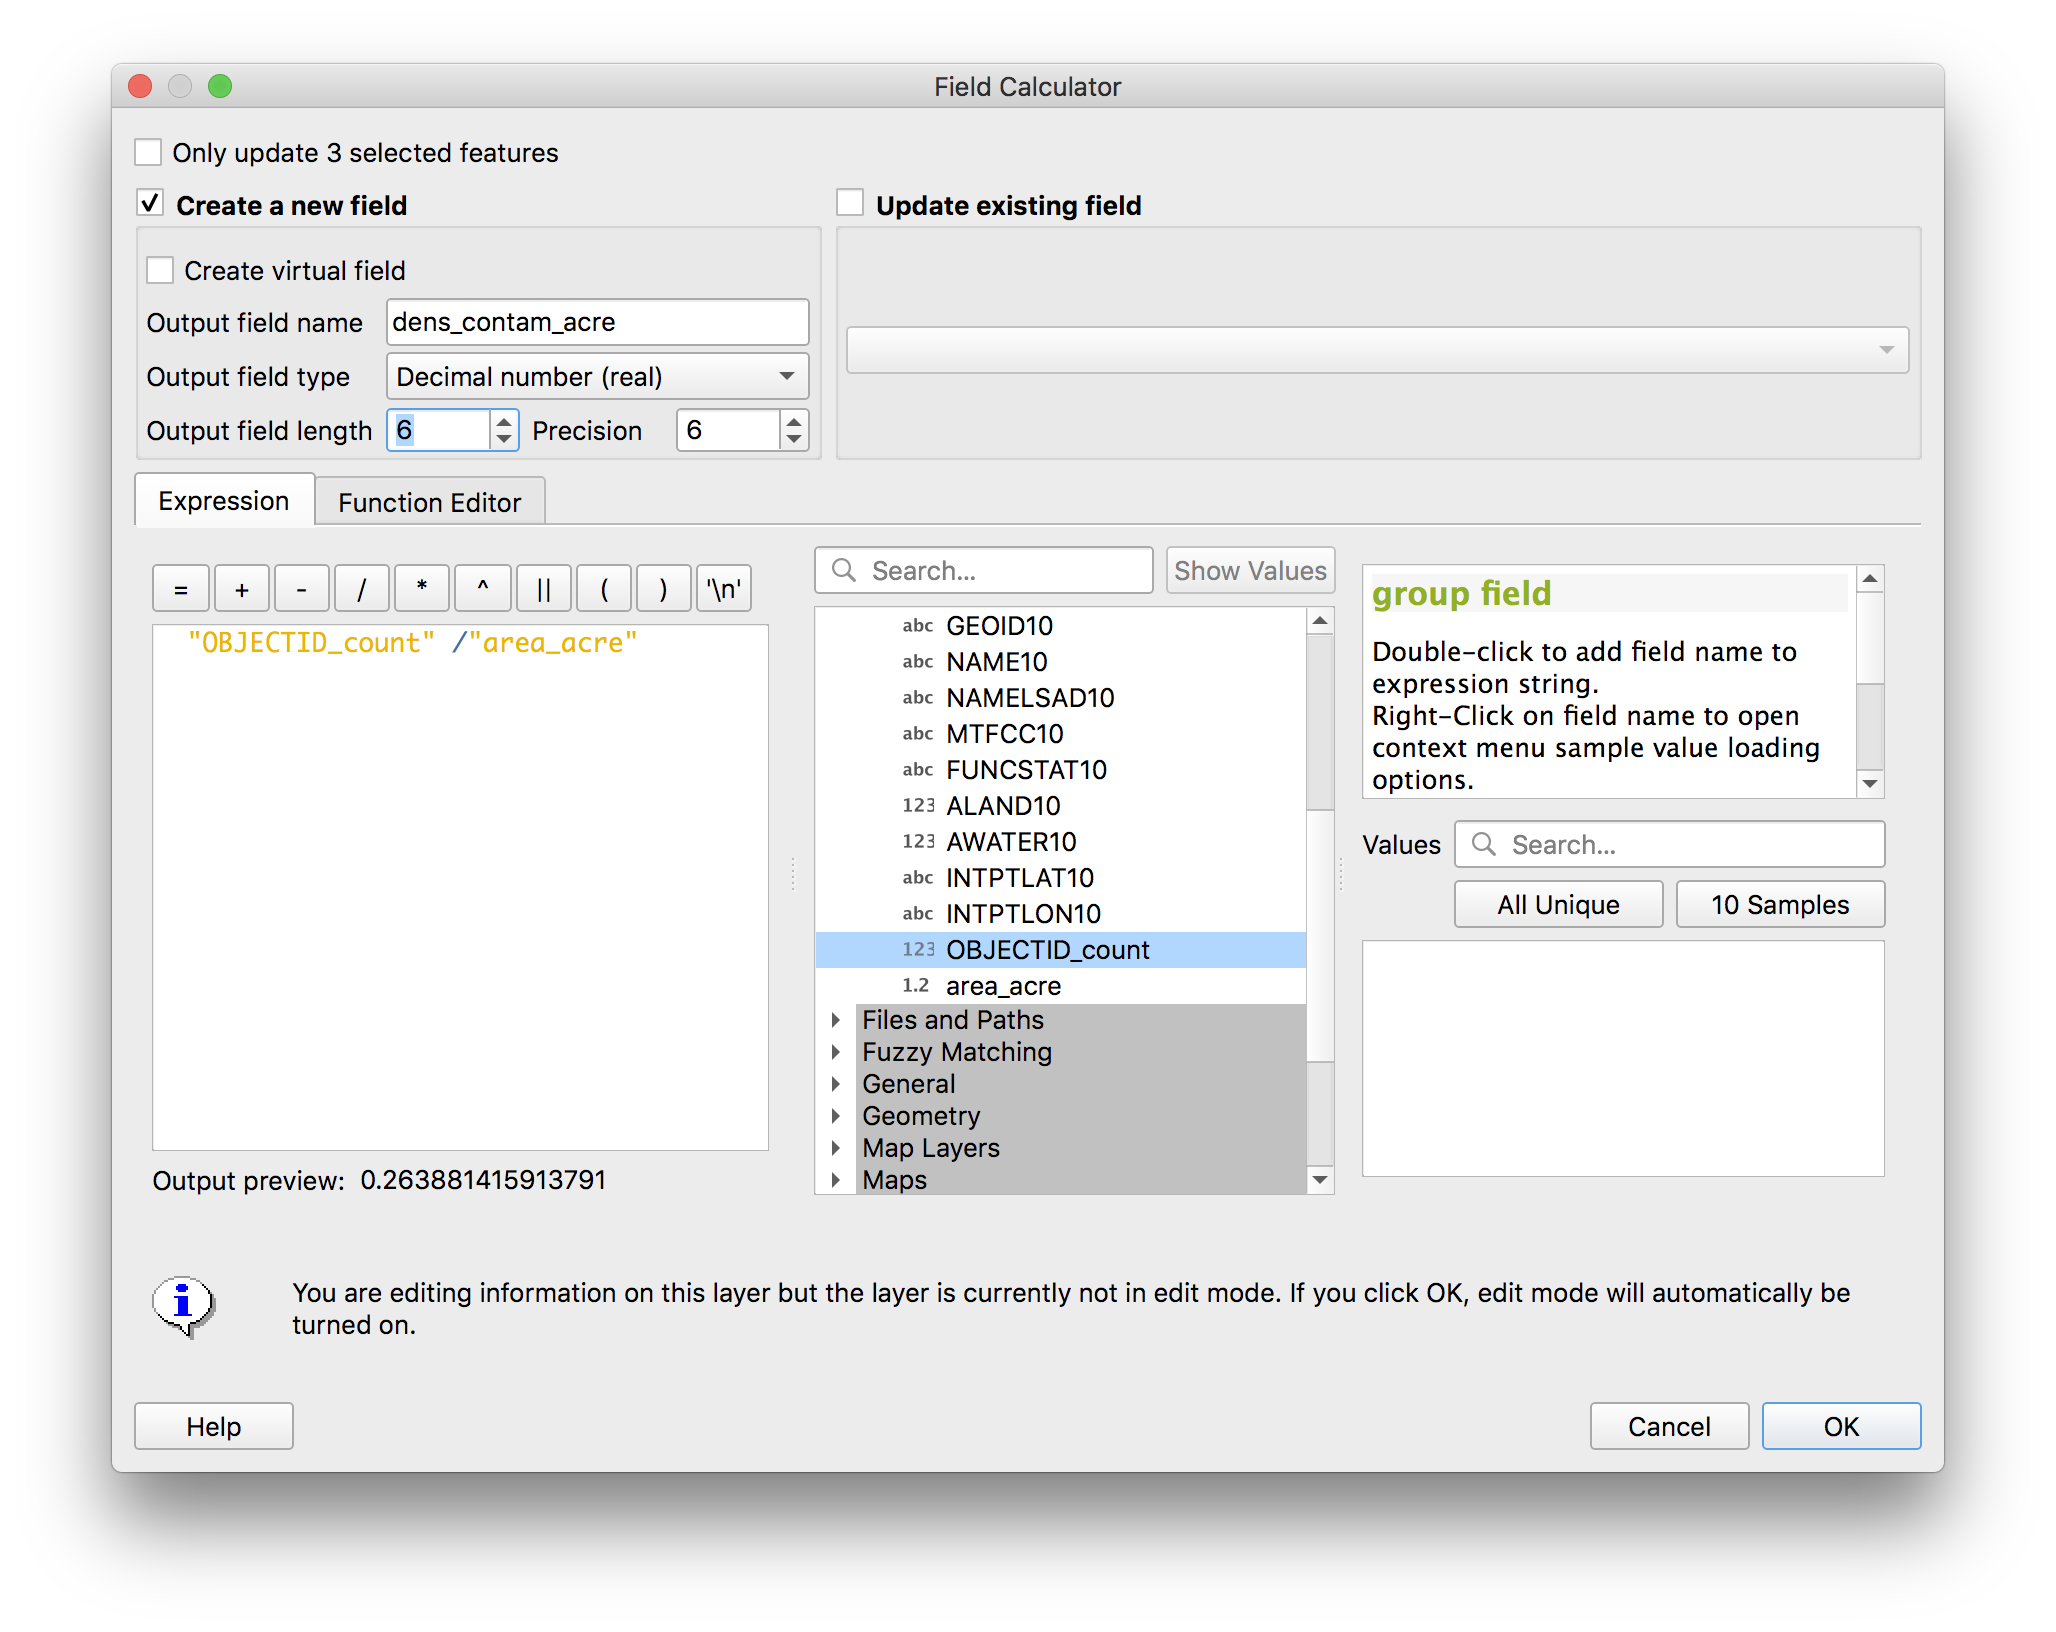
Now again use the field calculator to add a new field that contains values for the density of contaminated sites as sites/acre for each tract:
Repeat the above steps to calculate the density of contaminated sites for each census block.
Kernel density
Next you will visualize concentrations of contaminated sites using a heat map or kernel density map.
This is a raster based method for visualizing density of a phenomena across an area. As described in class this is a method whose results are highly dependent on the parameters you choose. Depending on parameters a kernel density map of the same data can look wildly different. The value of a kernel density map is primarily in visualization (not numeric output). One goal for this component of the assignment is to make you very suspicious of ‘heat maps’ which you encounter from other sources.
In creating a kernel density there are two main parameters:
- the search radius from each feature
- cell size of the output raster
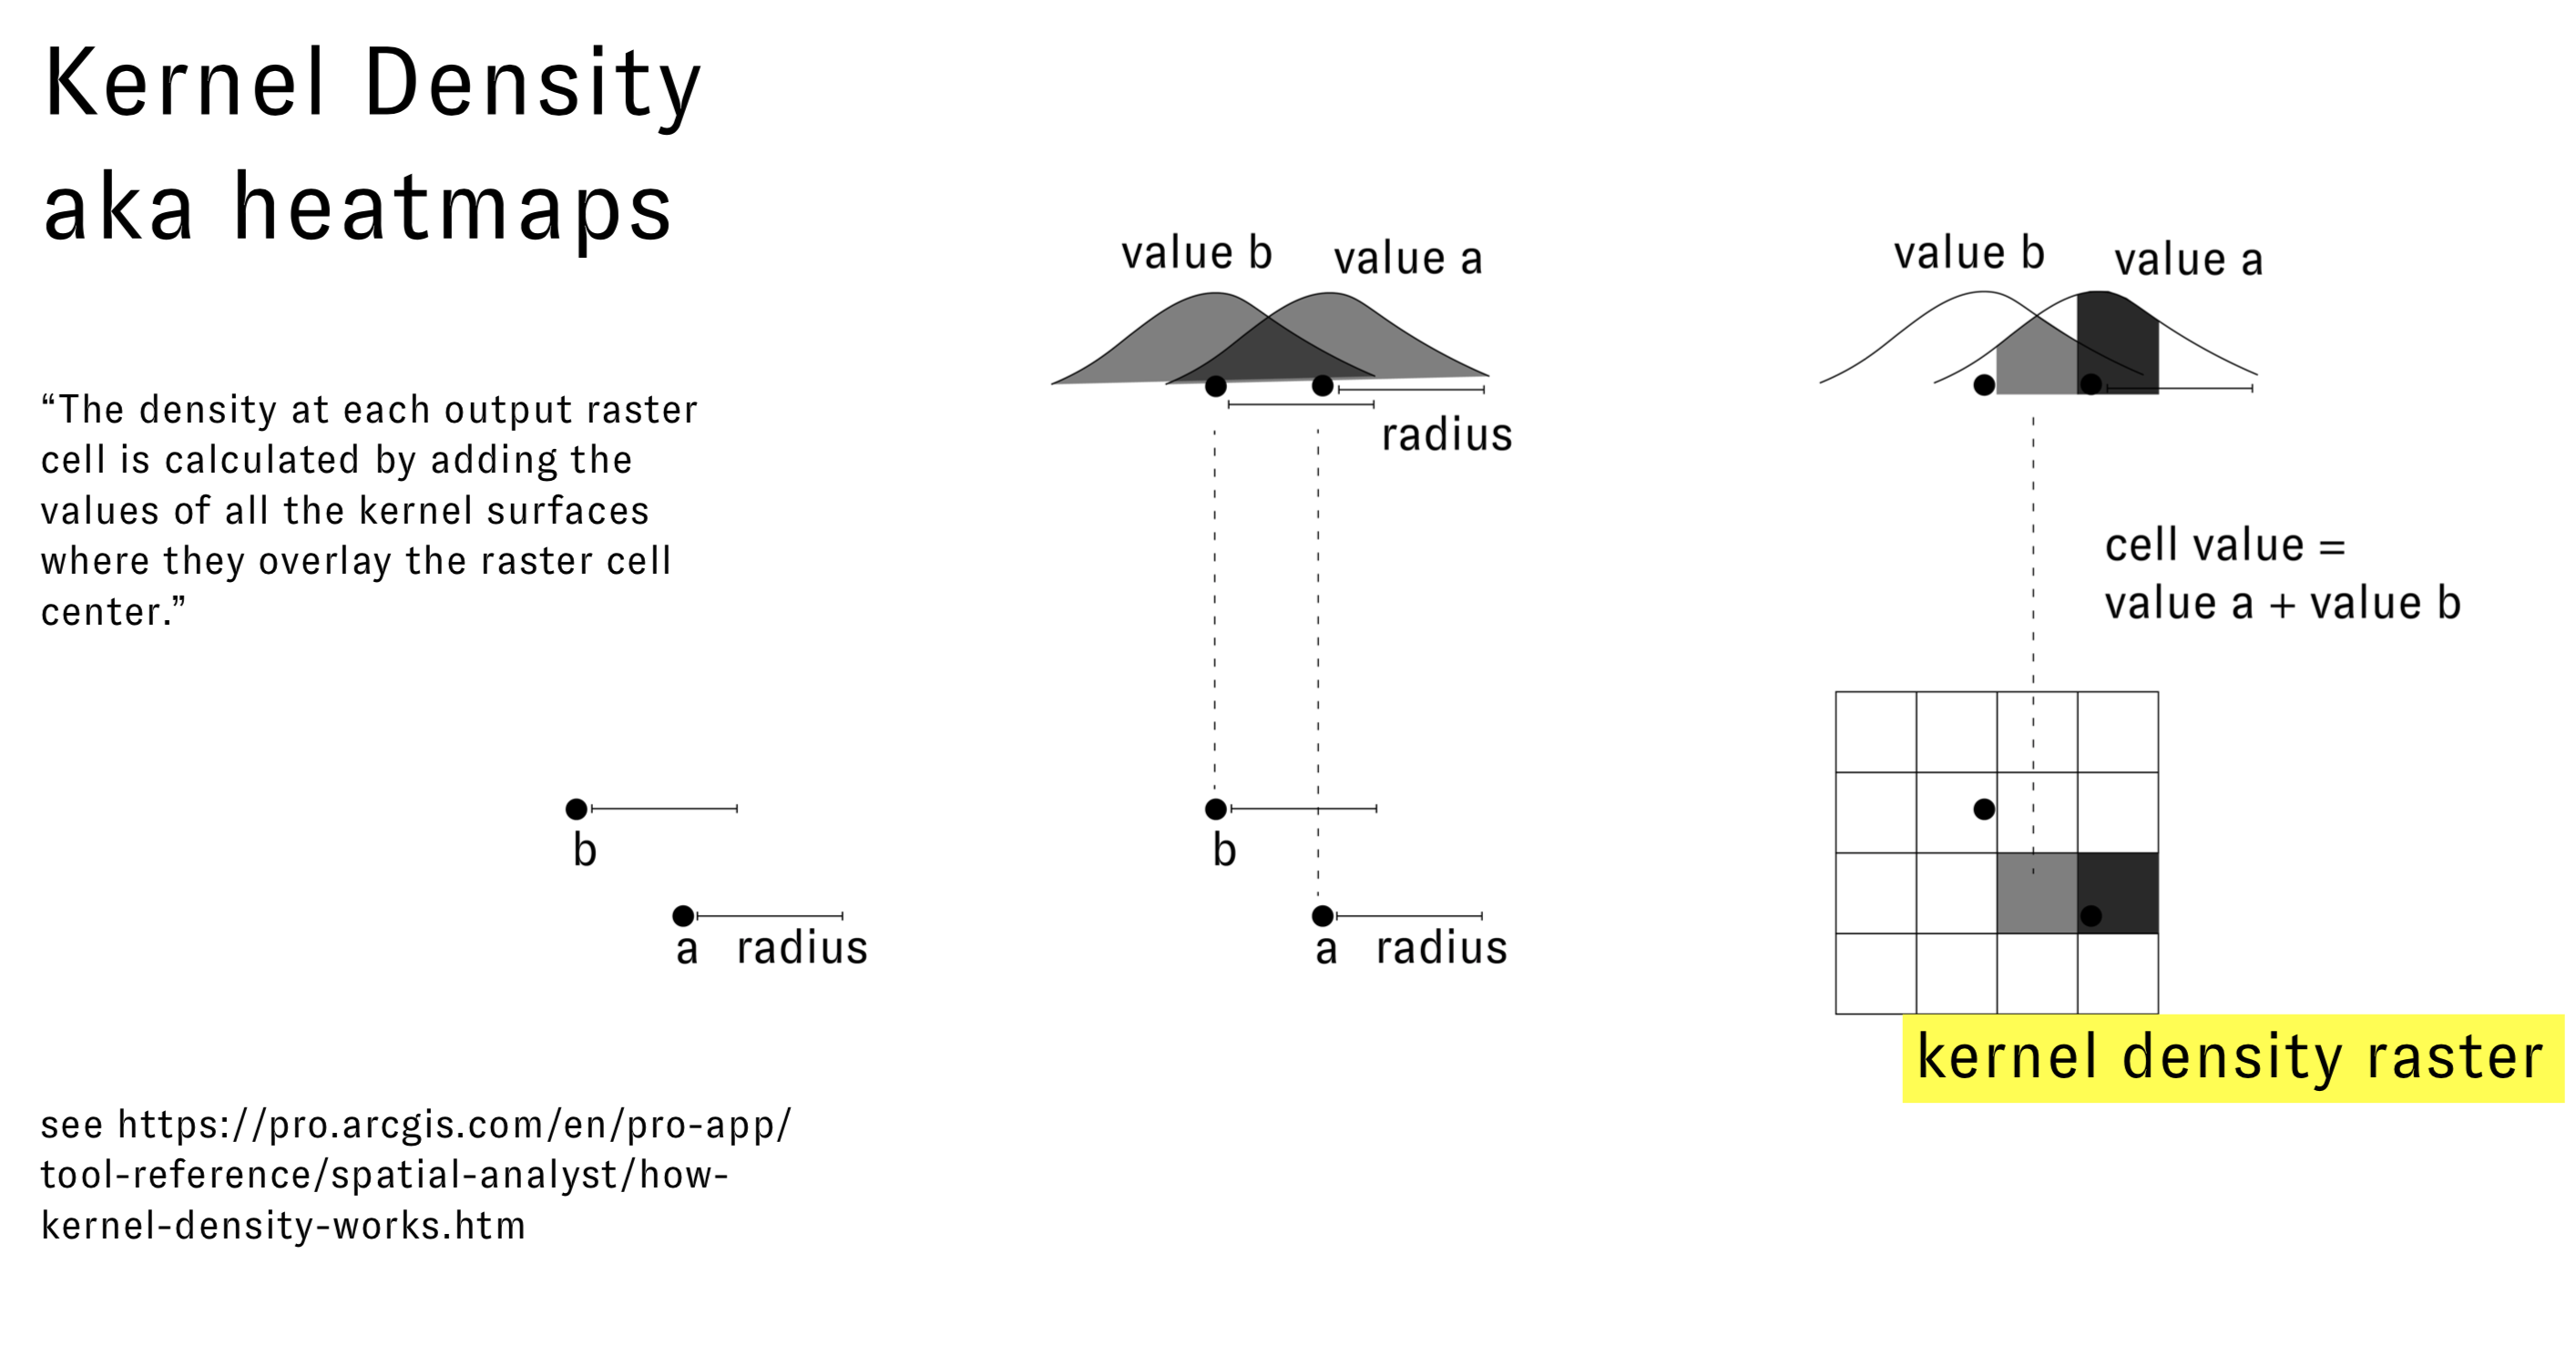
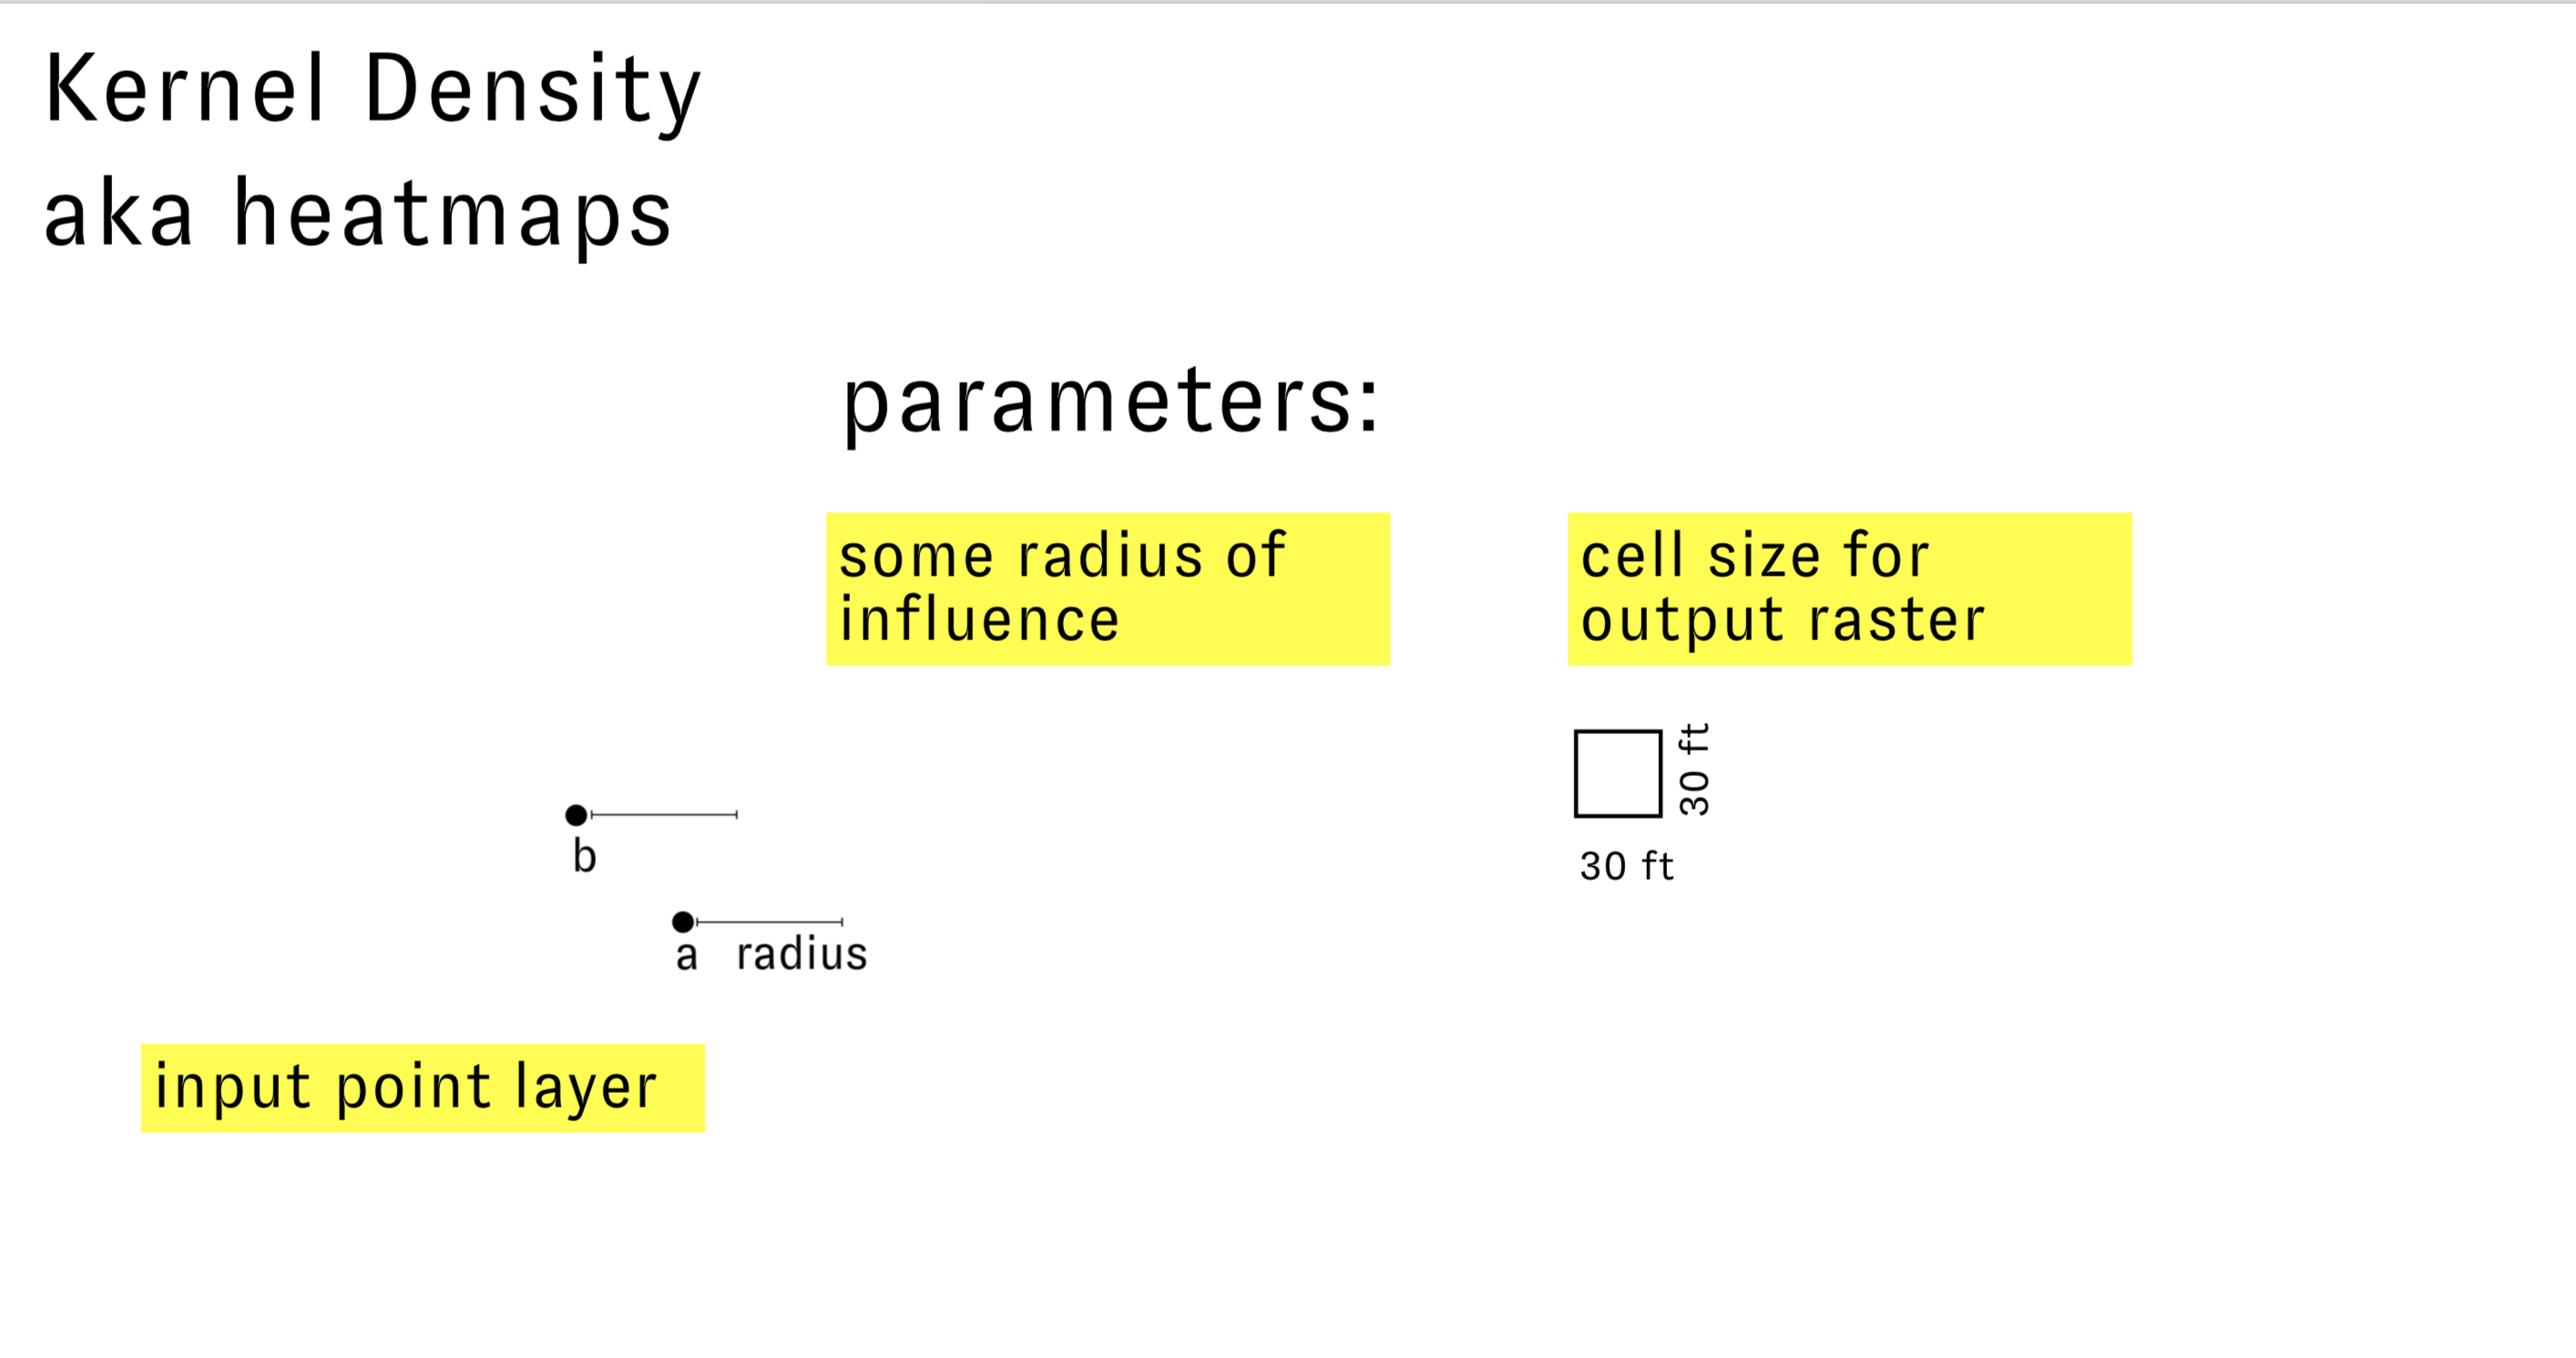 You can think of the search radius as a kind of ‘zone of influence’ for each feature. Thus this radius should be chosen with some knowledge of the local geography and the impact of the feature. In other words, for the case of our example how far away from contaminated site do I need to be before it no longer has any effect on me.
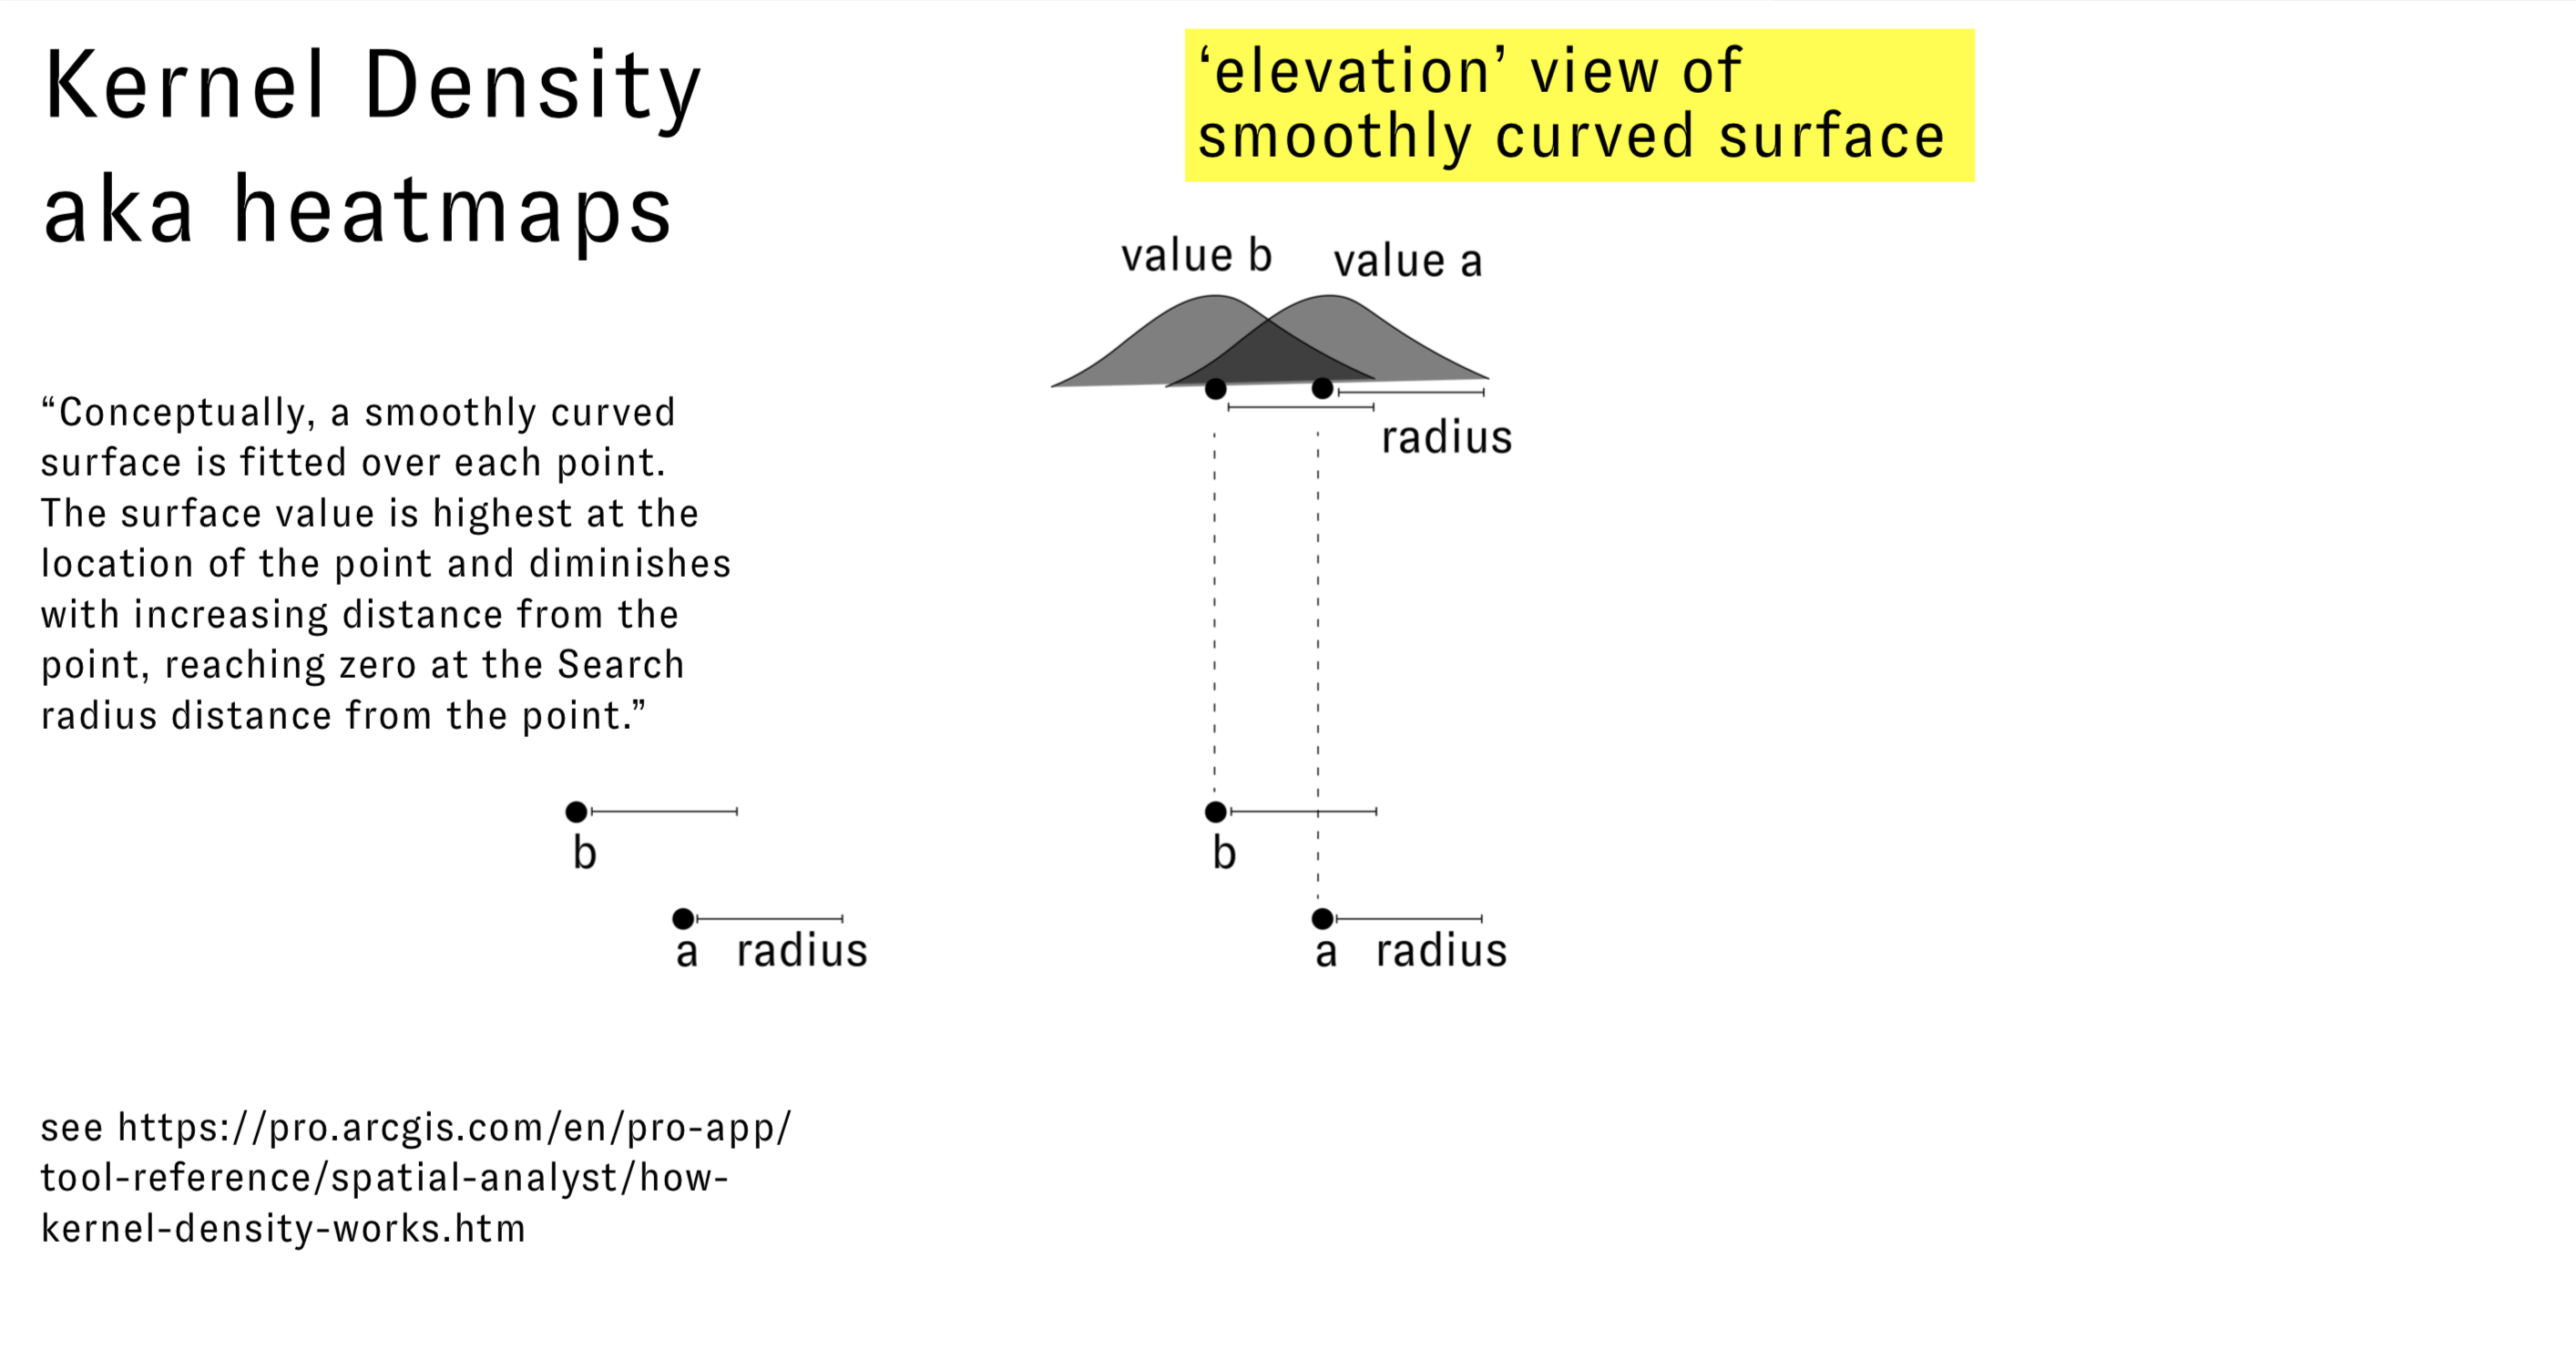
For each point a smooth surface is fitted over the point which is at its maximum above the point and reduces in value as it approaches the specified search radius. At the radius it is zero. This is illustrated in the diagram below:
The value for each output kernel density raster cell is the sum of the values for each kernel surface at the centroid of the cell:
Now to execute this in QGIS:
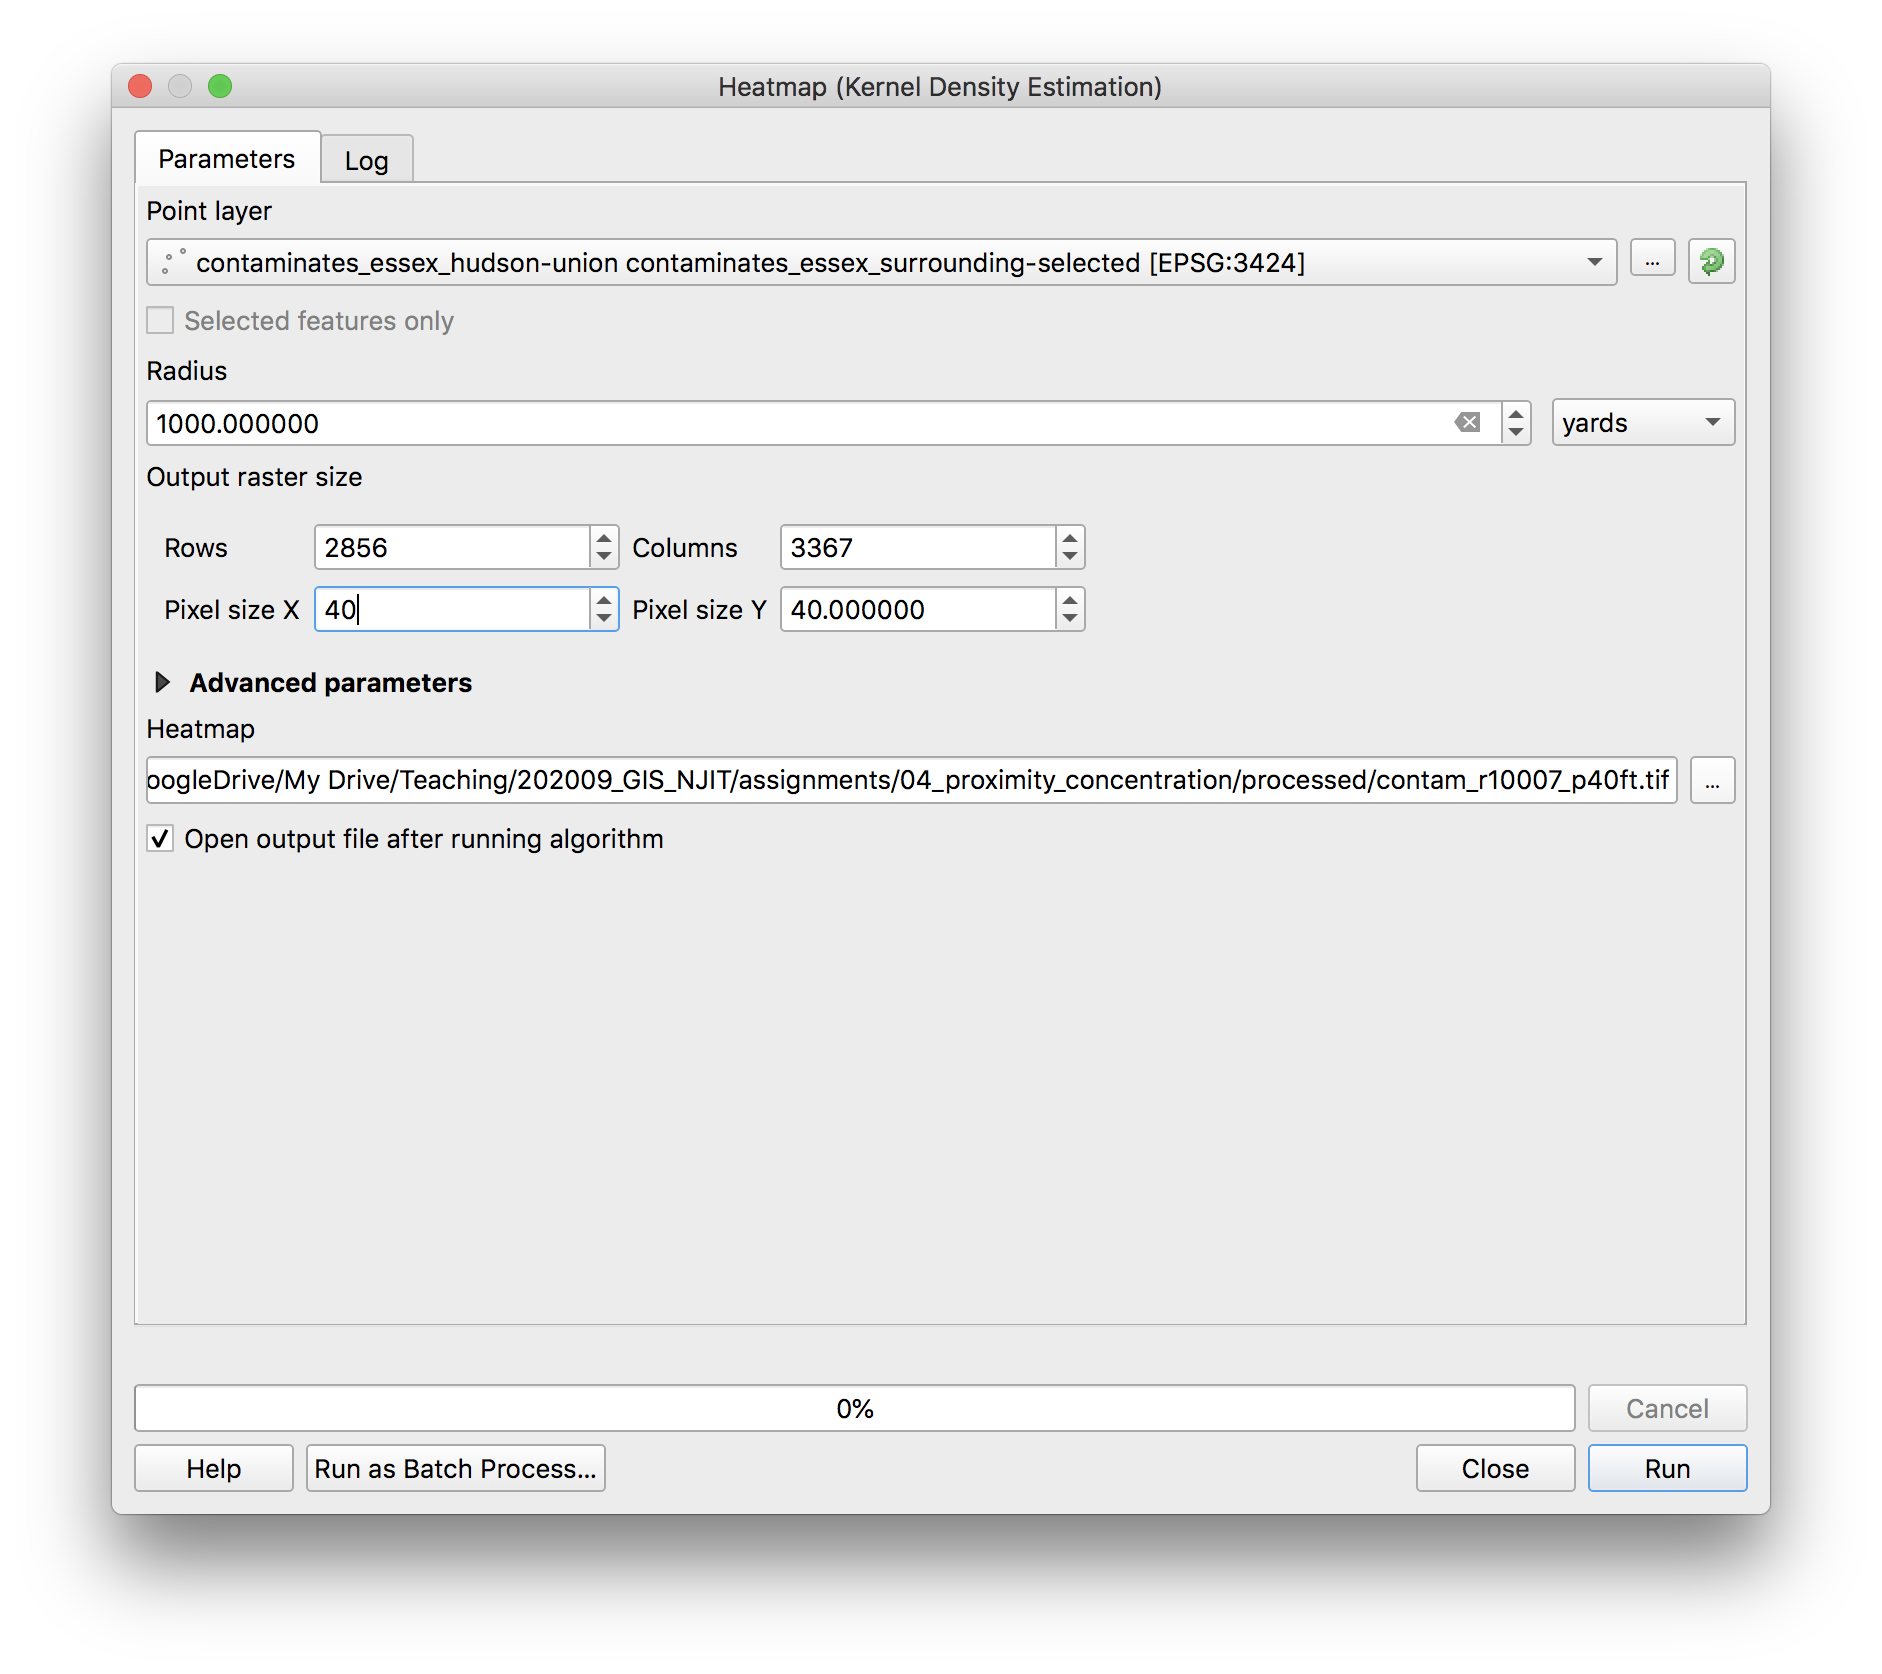
In the Processing Toolbox under Interpolation open the Heatmap (Kernel Density Estimation) tool. Make the following selections and save your output raster with a file name that indicates the search radius and cell size in the processed folder for this assignment (i.e. contam_r10007_p40ft.tif).
As a starting point use a 1000 ft search radius (note the units of the search radius are always the same as the units of the coordinate reference system of the input point layer), and 40ft for the cell size.
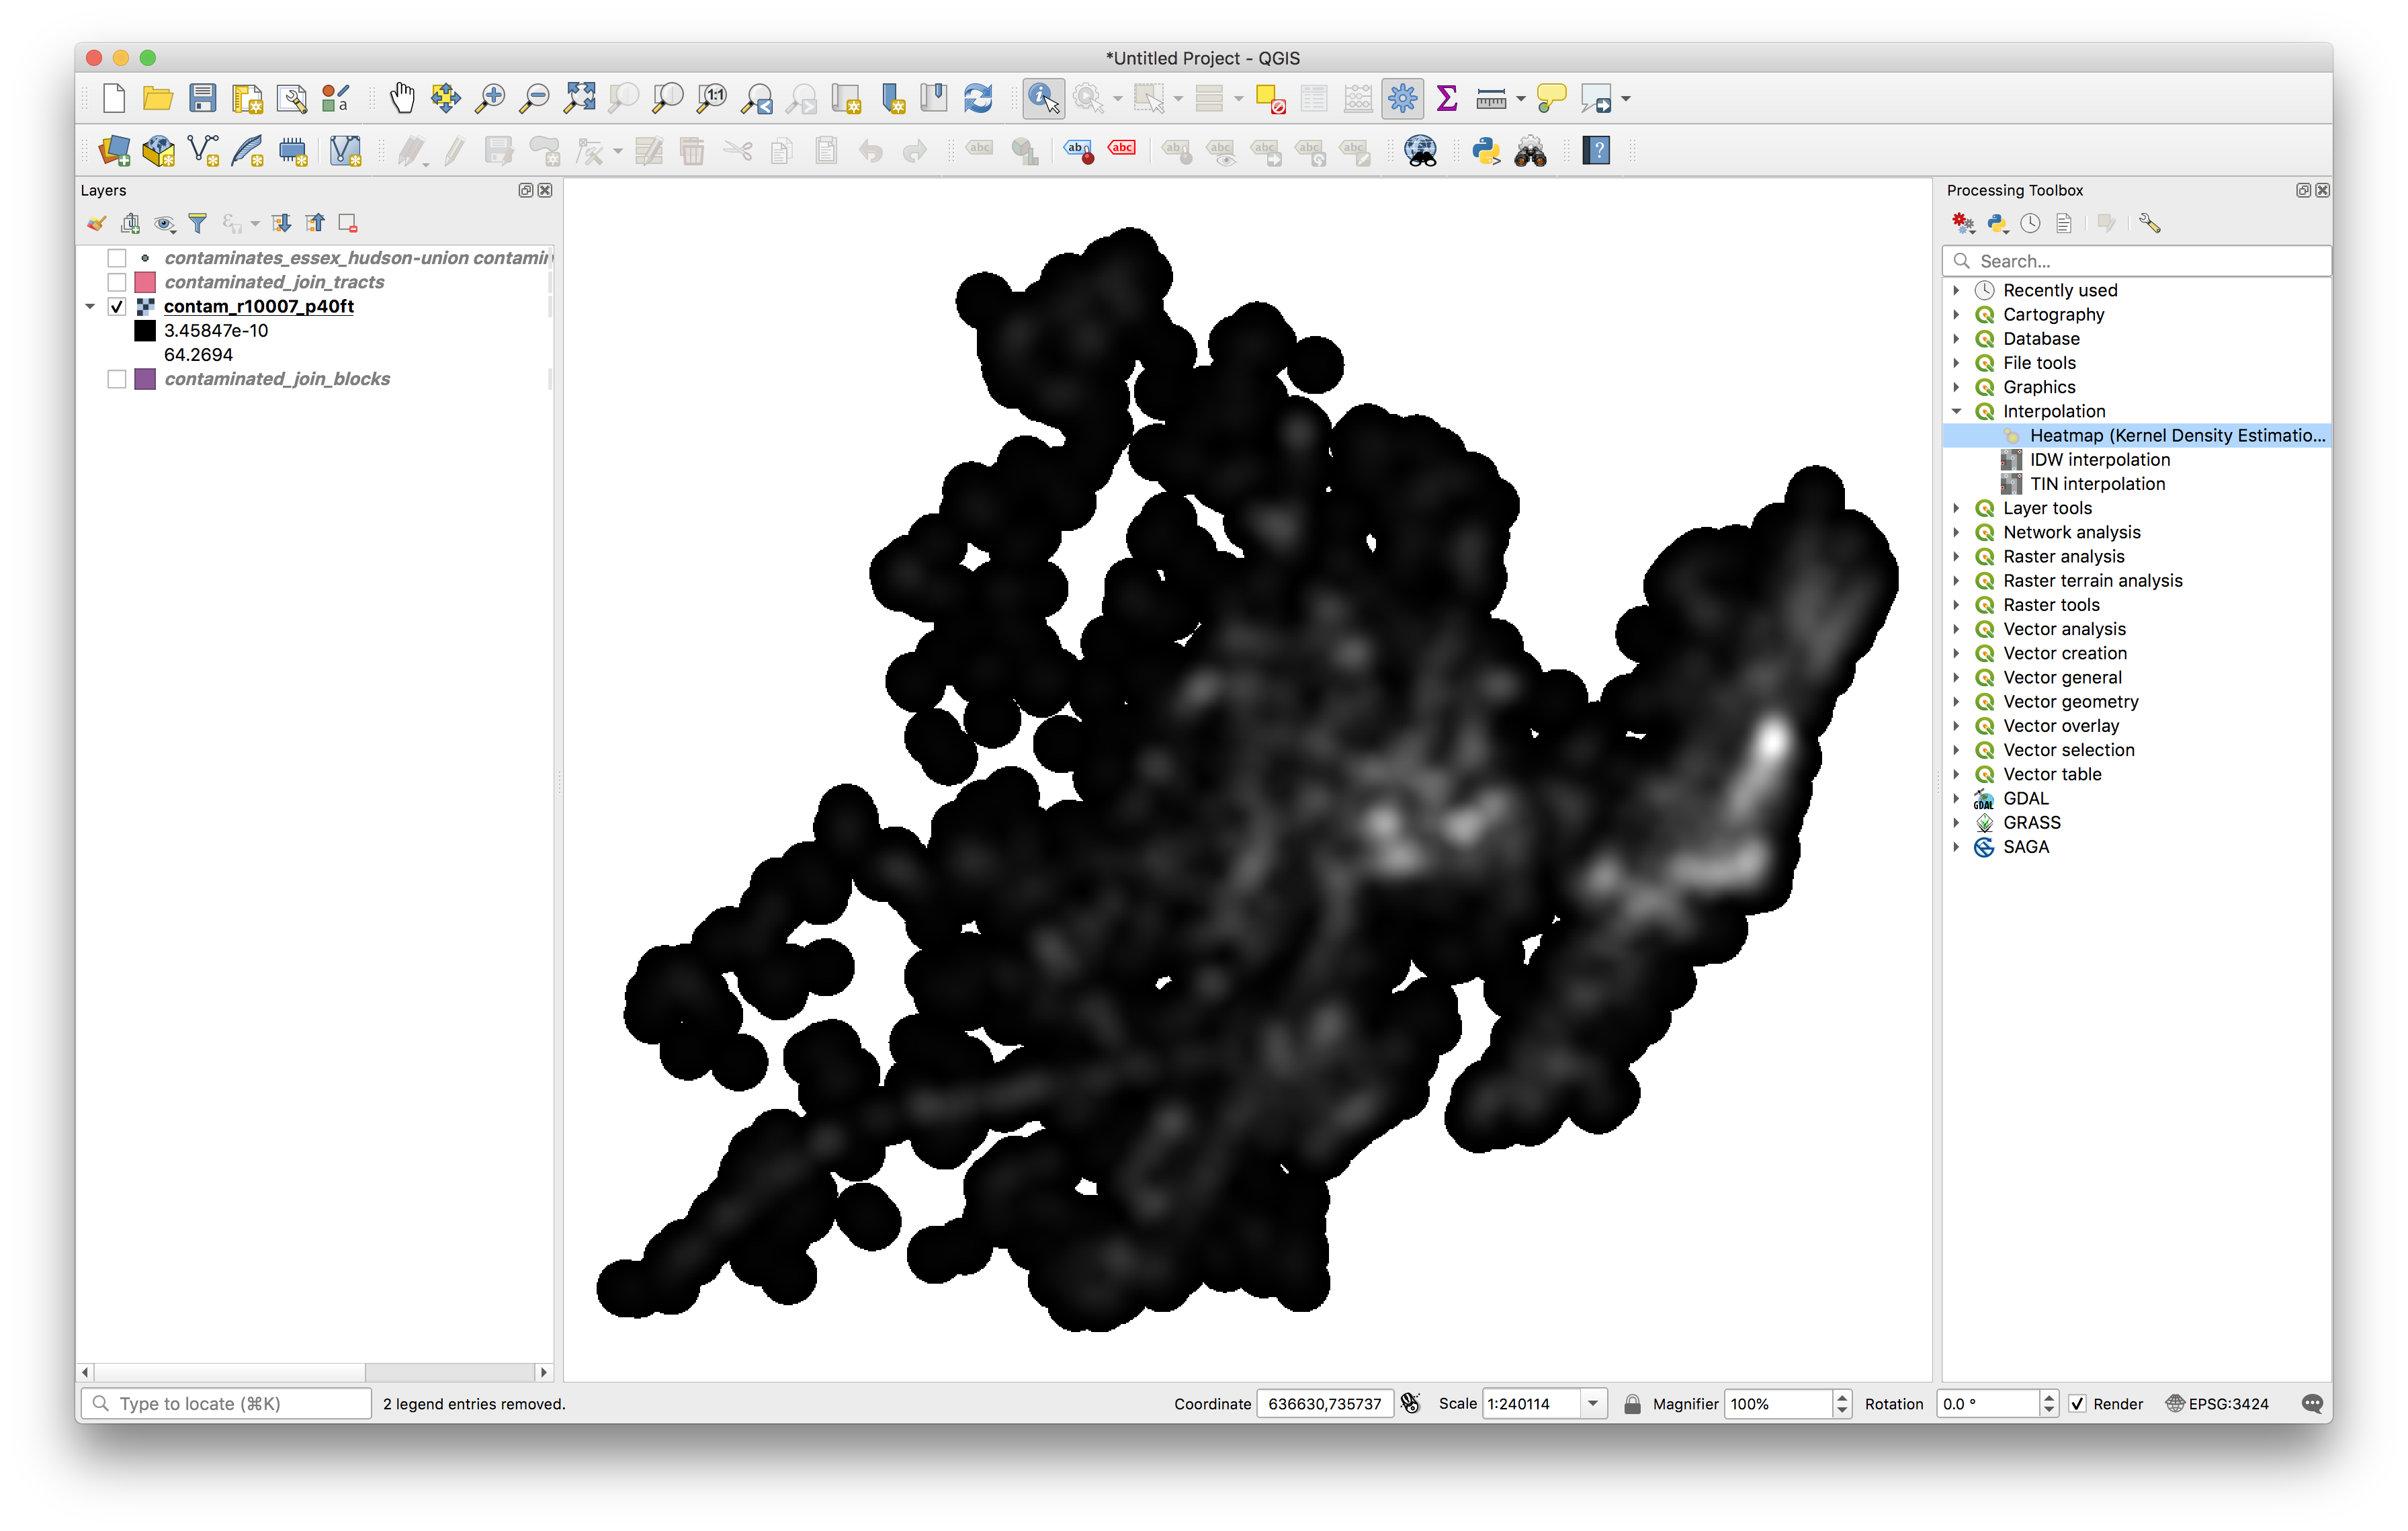
 The output raster should look like this:
Experiment with different search radii and cell sizes (perhaps doing research on legislation related to distance from contaminated sites) until you have a kernel density raster that you feel makes the argument you would like to make about contaminated sites in Newark and its surroundings.
Symbology & Map Composition
Symbolize both the tracts and the blocks as choropleth maps using a manual classification scheme based on natural breaks. Make sure to use the same breaks in the data for both maps to allow for comparison between the two maps.
Use a single band pseudocolor ramp to visualize your chosen kernel density map.
Create a single map composition with three maps that shows the density of contaminated sites by block, by tract, and with a kernel density. Use the same geographic extents and scale for each map
Include on your map composition:
- title
- subtitle for each map
- legend (that shows the units for the density values in each choropleth map & that includes the search radius for the chosen kernel density map)
- scale bar
- annotation showing the 3 census tracts & census blocks with the highest density of contaminated sites
- layers to give context to your map reader from any of the previous assignments (roads, building footprints, etc)
Part B: Proximity & Network Analysis
In part b of this assignment you will use Network Analysis tools to answer the following questions:
How many buildings are within 1/4 mile on the ground walking distance of the Diamond Alkali Company superfund site?
What are the shortest path distances from the site to each school in Newark?
Setup:
Make sure you have downloaded all datasets required for assignment 4 here. (Newark Schools and Newark_area_roads are two datasets added since 10/21 that you will specifically need for the second part of the assignment. If you downloaded the assignment previously please download these datasets and save them in the data folder for assignment 4.)
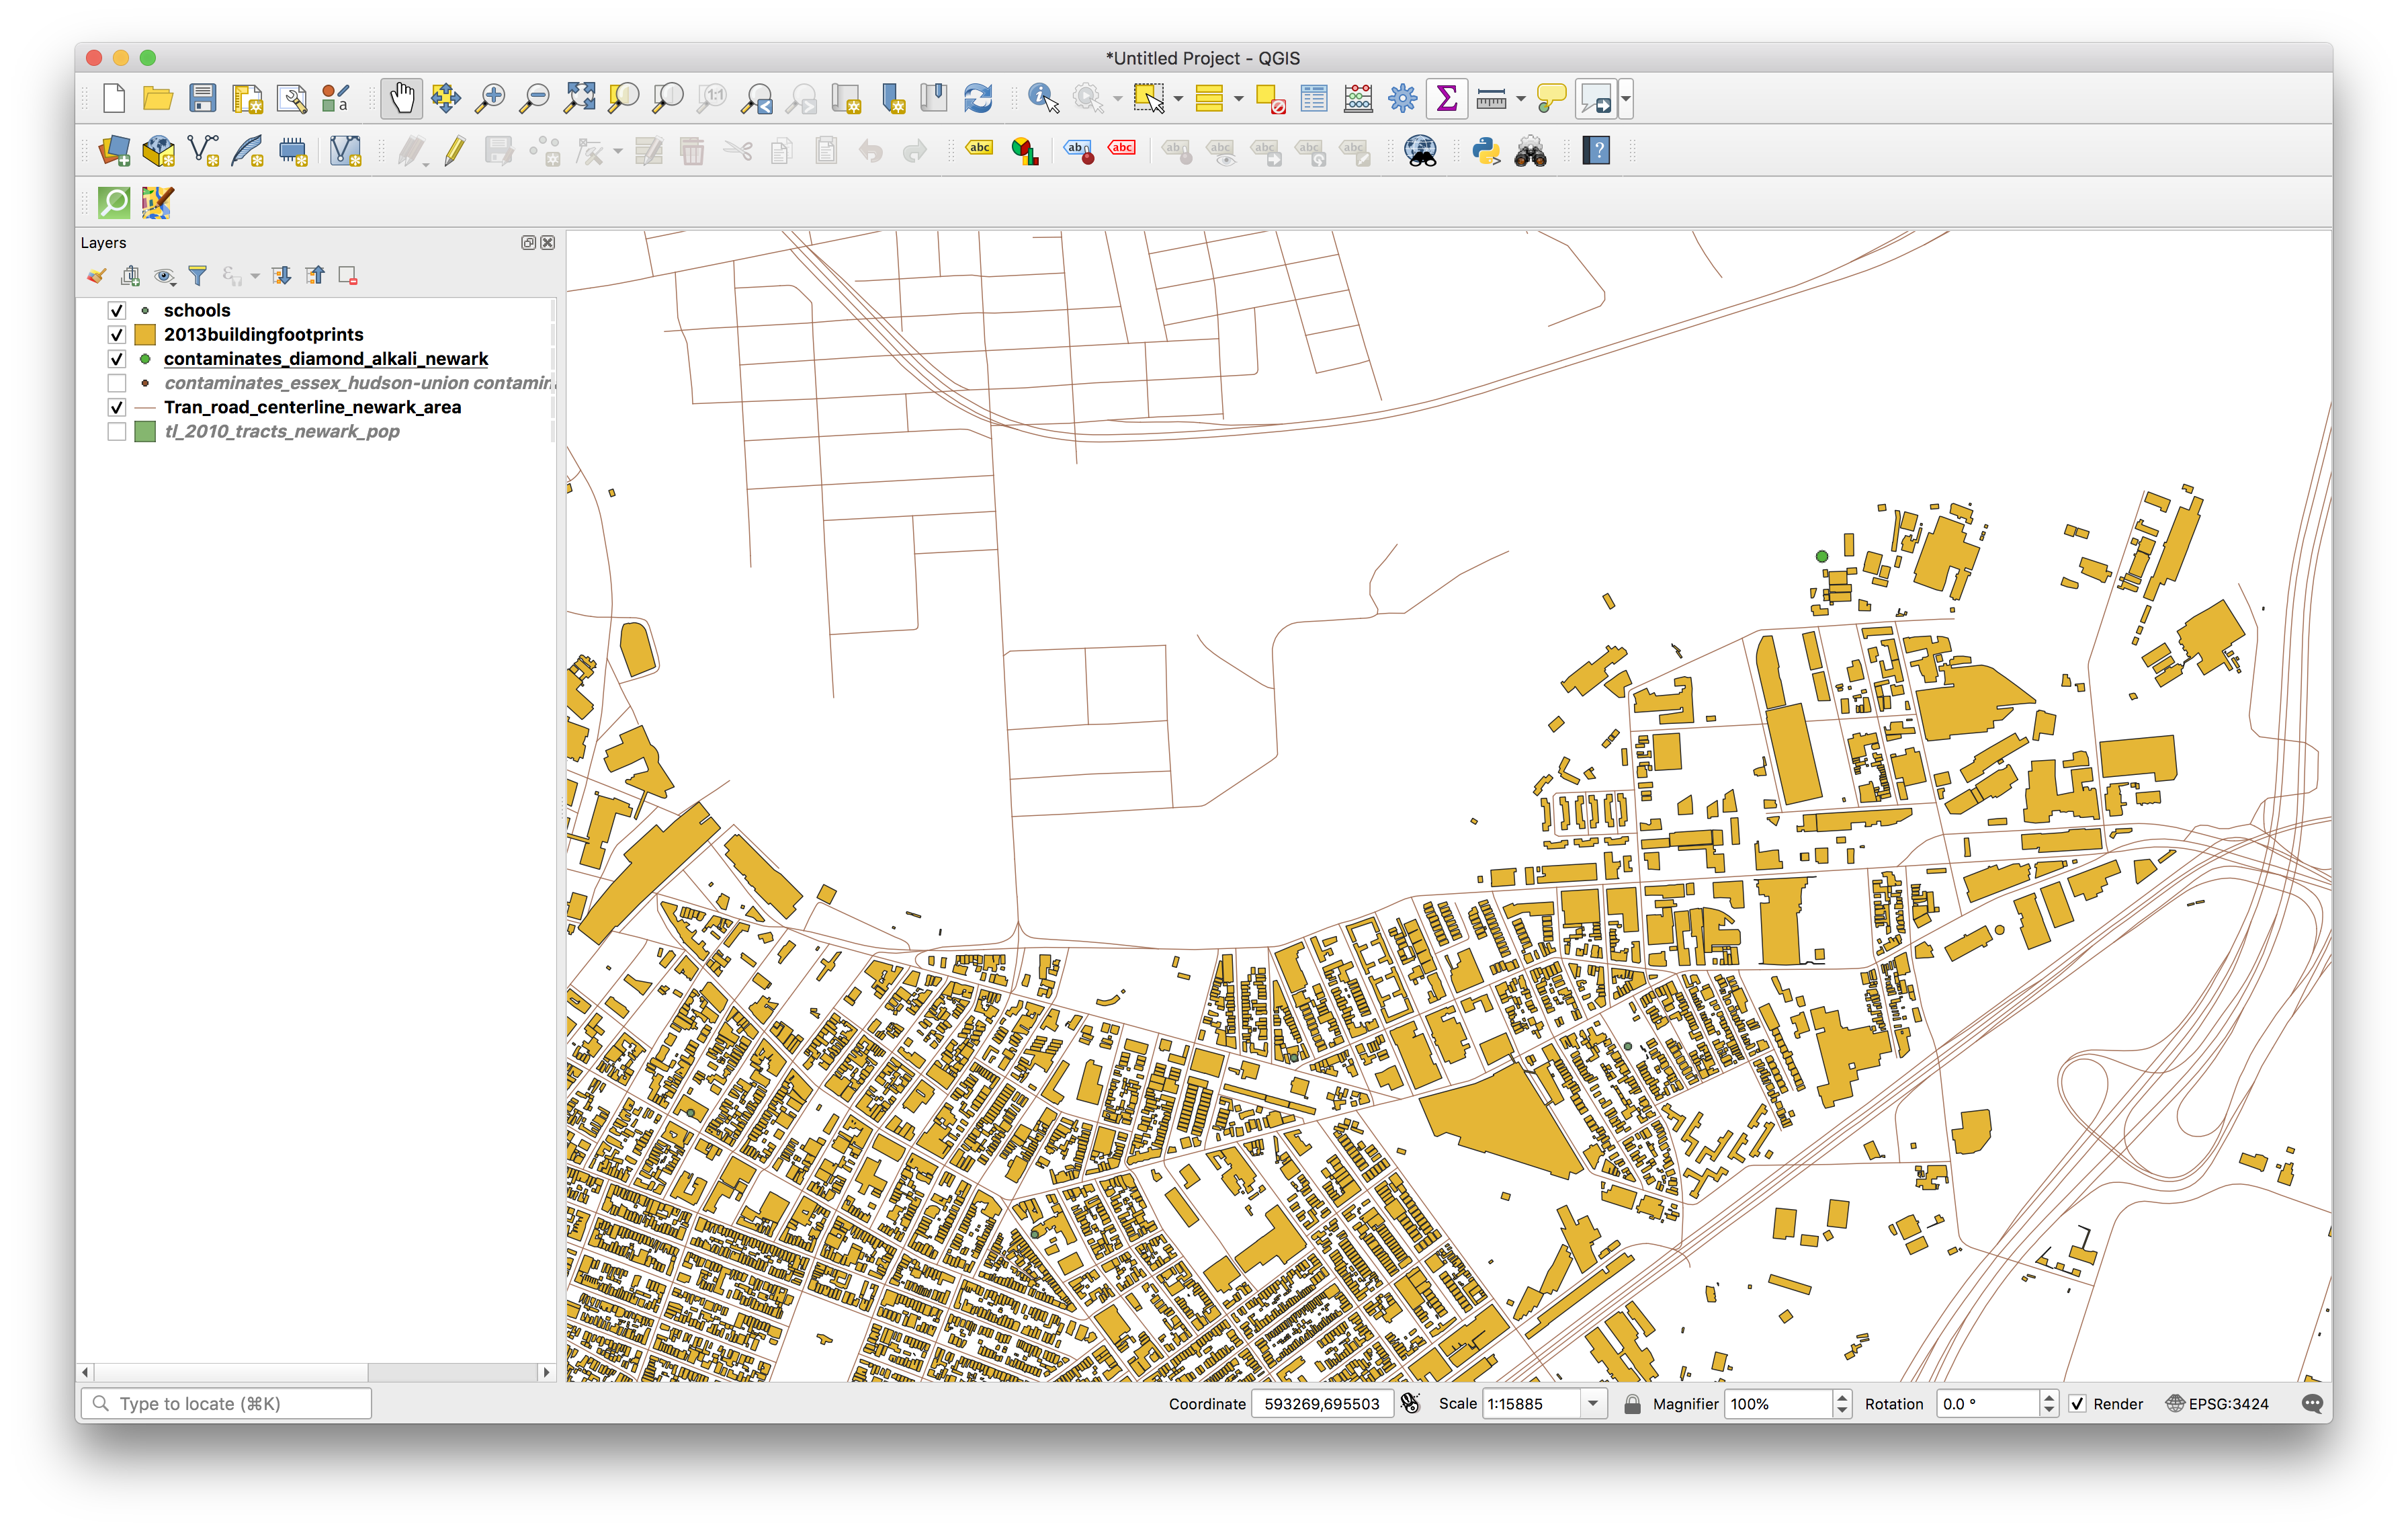
Add data:
- NJDEP Contaminated Sites (you can review the metadata here)
- Newark Area Roads
- Newark Schools
- Newark Buildings
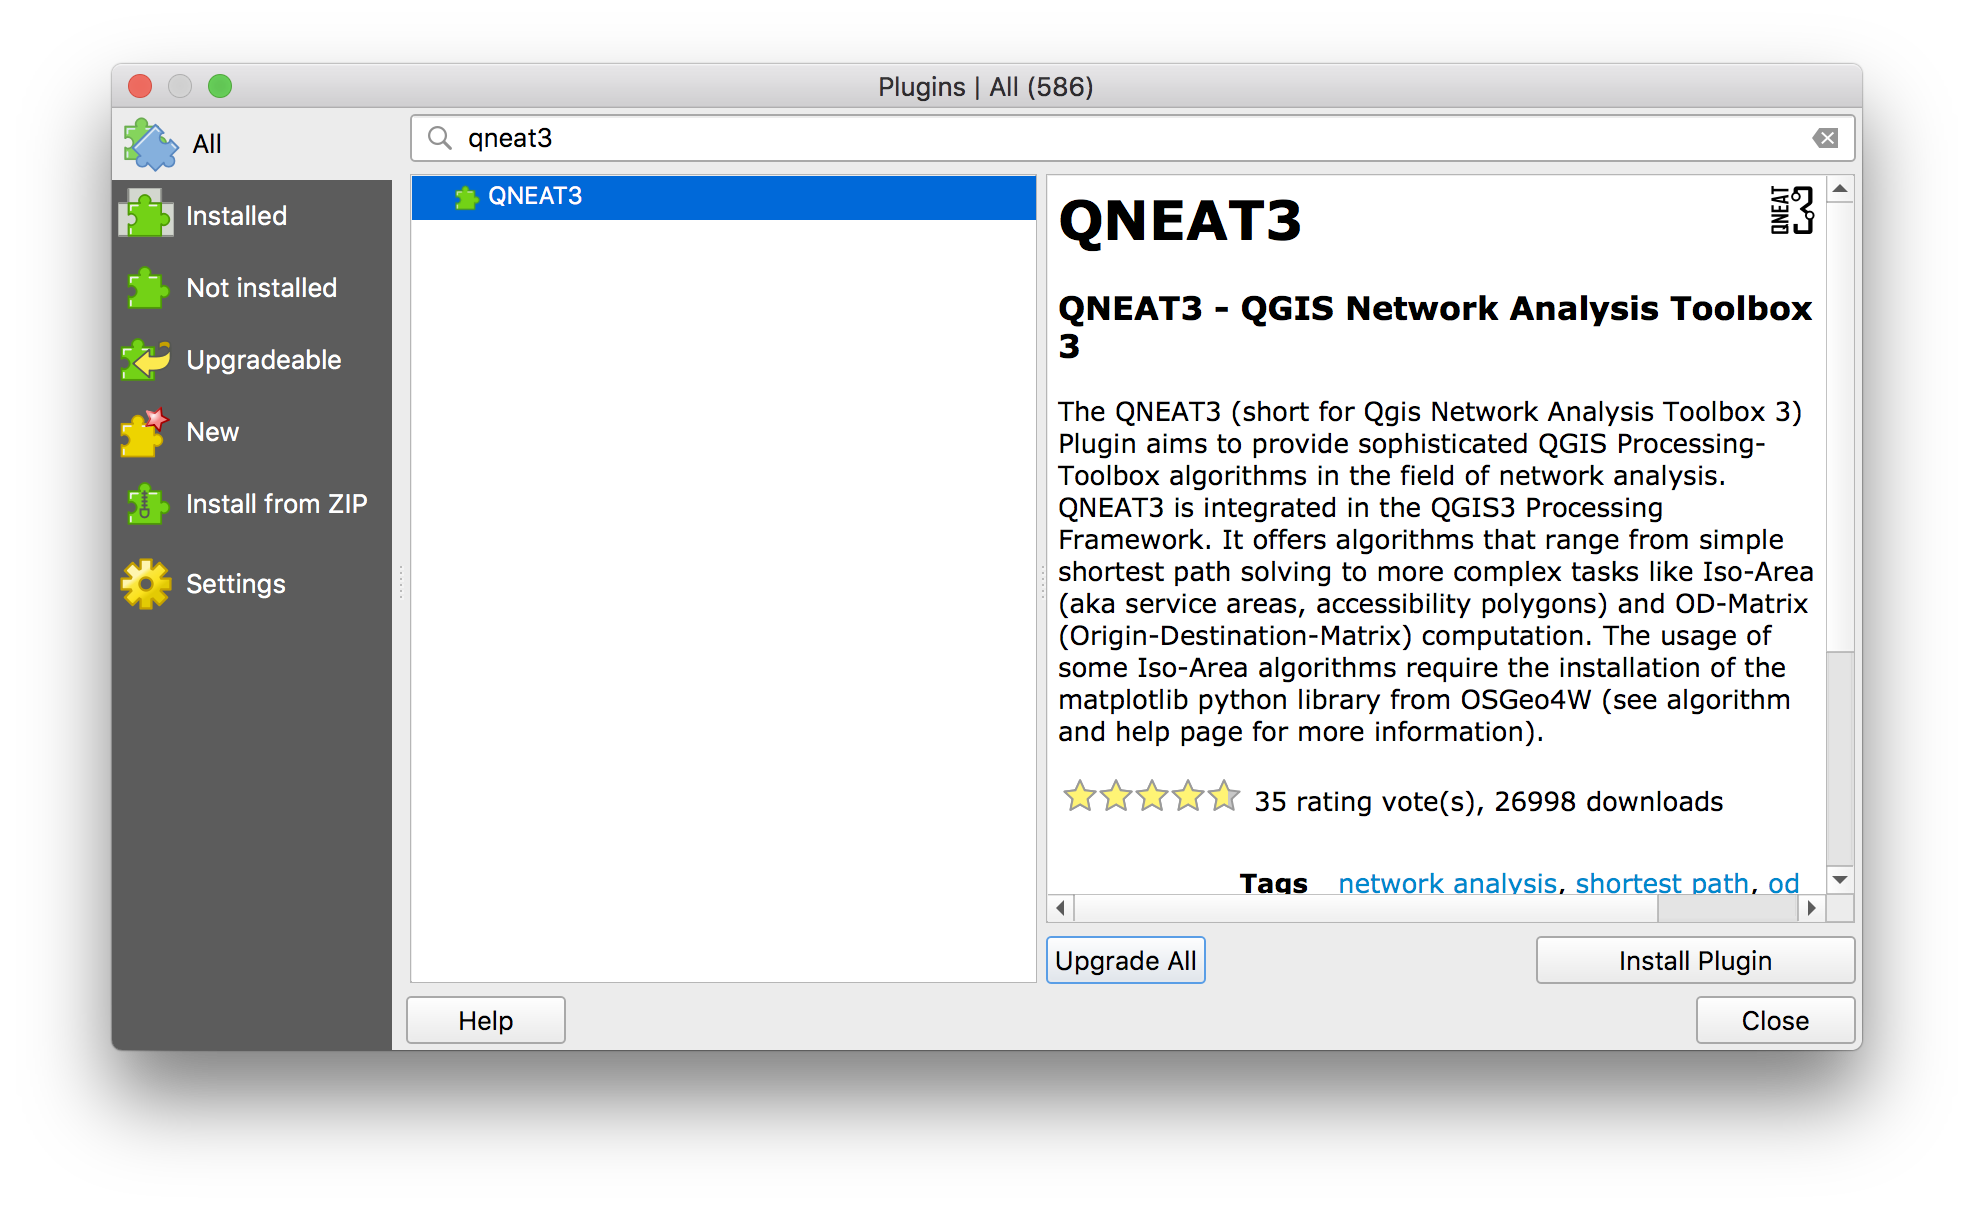
Install a plugins that will be needed for the network analysis portion:
- QNEAT3
To install this plugin navigate to Plugins>Manage and Install Plugins in the top navigation menu.
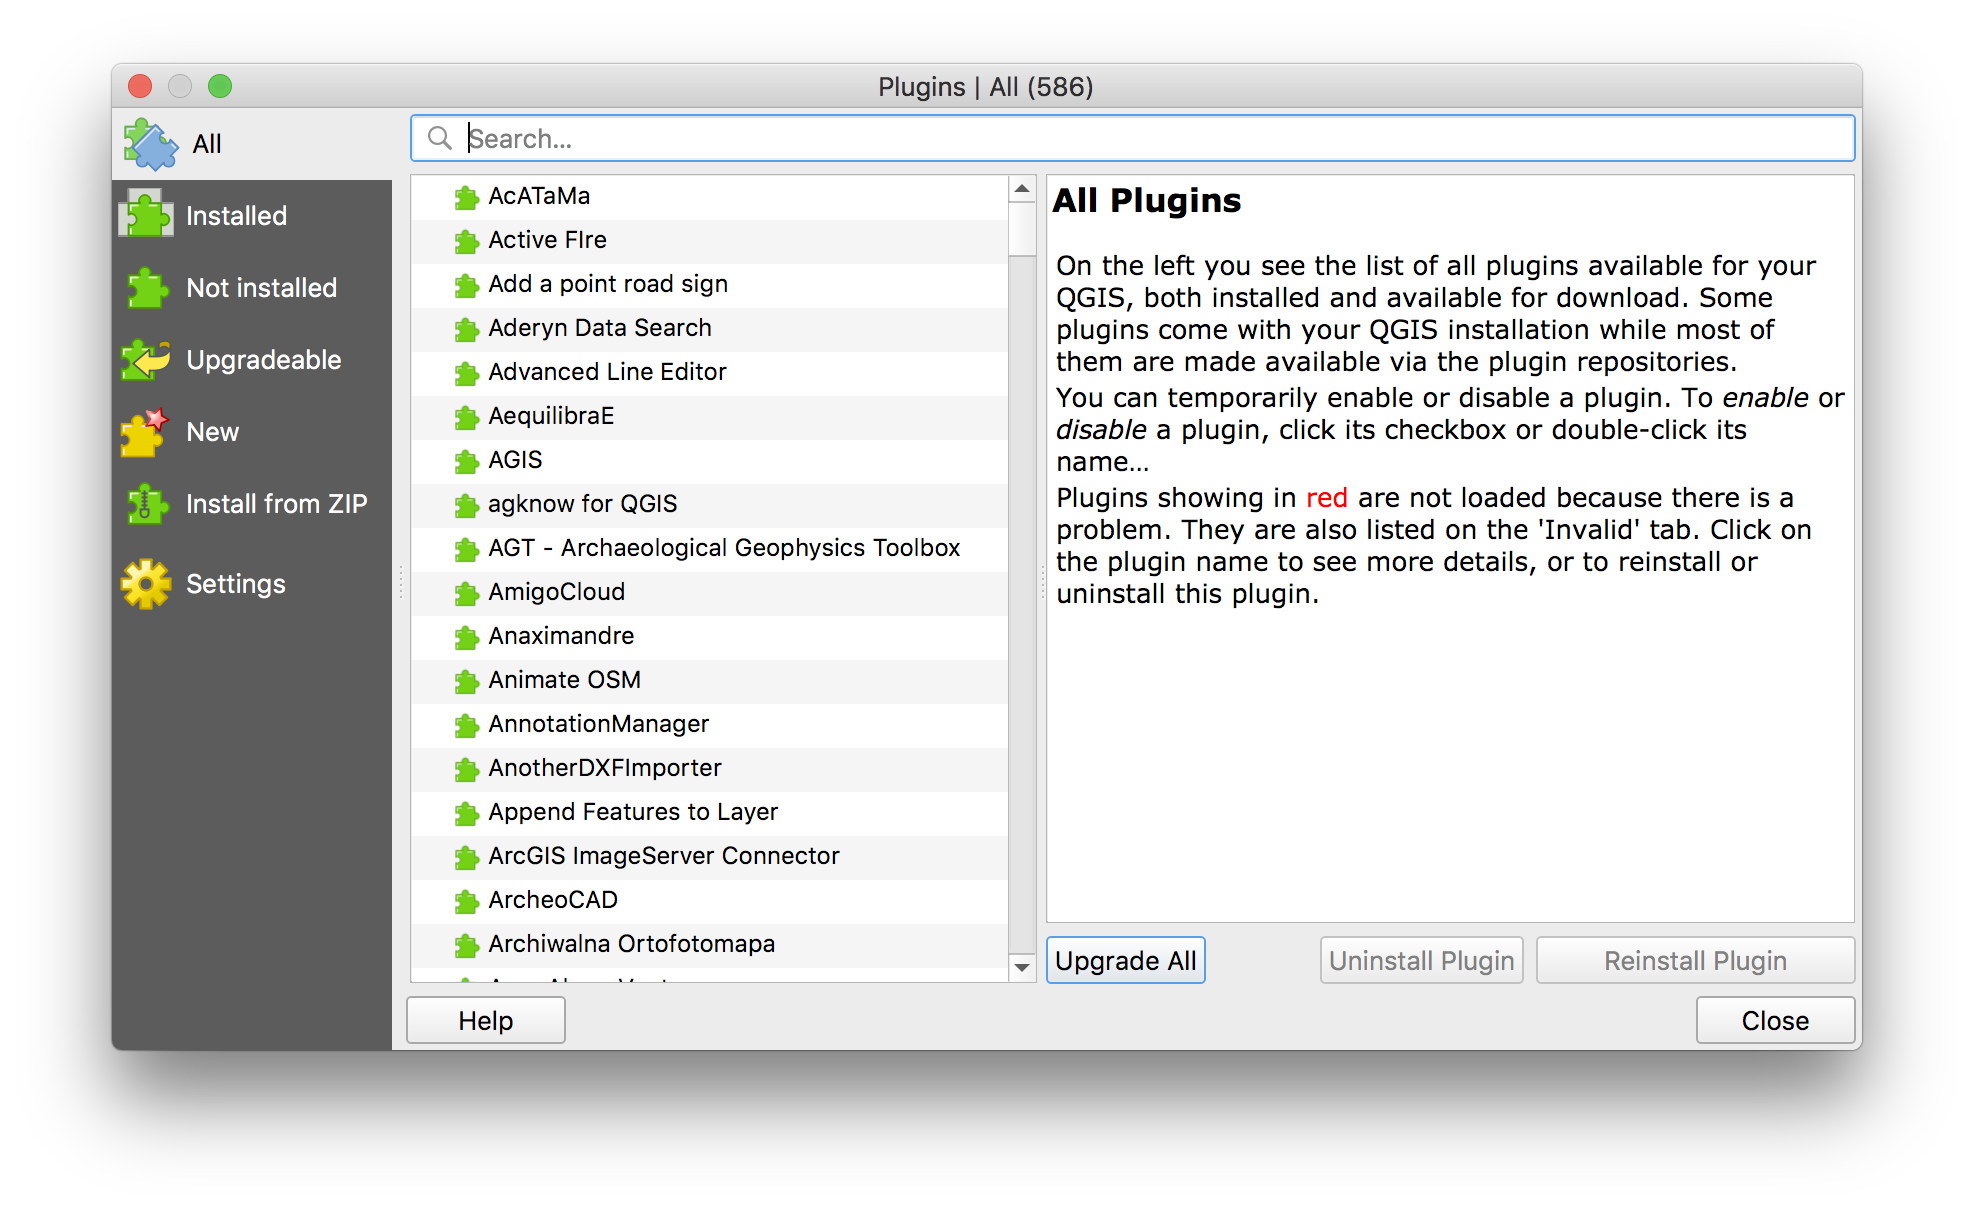
Use search bar to look up QNEAT3. Then click Install plugin,
Diamond Alkali Company & Nearby Buildings
First you will answer the question: How many buildings are within 1/4 mile on the ground walking distance of the Diamond Alkali Company superfund site?
You can read more about superfund designations here and about the history of the Diamond Alkali site specifically here.
The steps you will execute to answer the above question are:
- Select just the Diamond Alkali Company superfund site from the
contaminates_essex_hudson-unionlayer - Save this as a new dataset with a single point
- Compute the Iso-Area around the site using the QNEAT3 Iso-Area tool
- Select buildings within the 1/4 mile network Iso-Area
Lets begin.
In the ontaminates_essex_hudson-union layer use select by location or select by attributes to find just the Diamond Alkali Company superfund site. The PI_NAME field is the site name (DIAMOND ALKALI COMPANY).
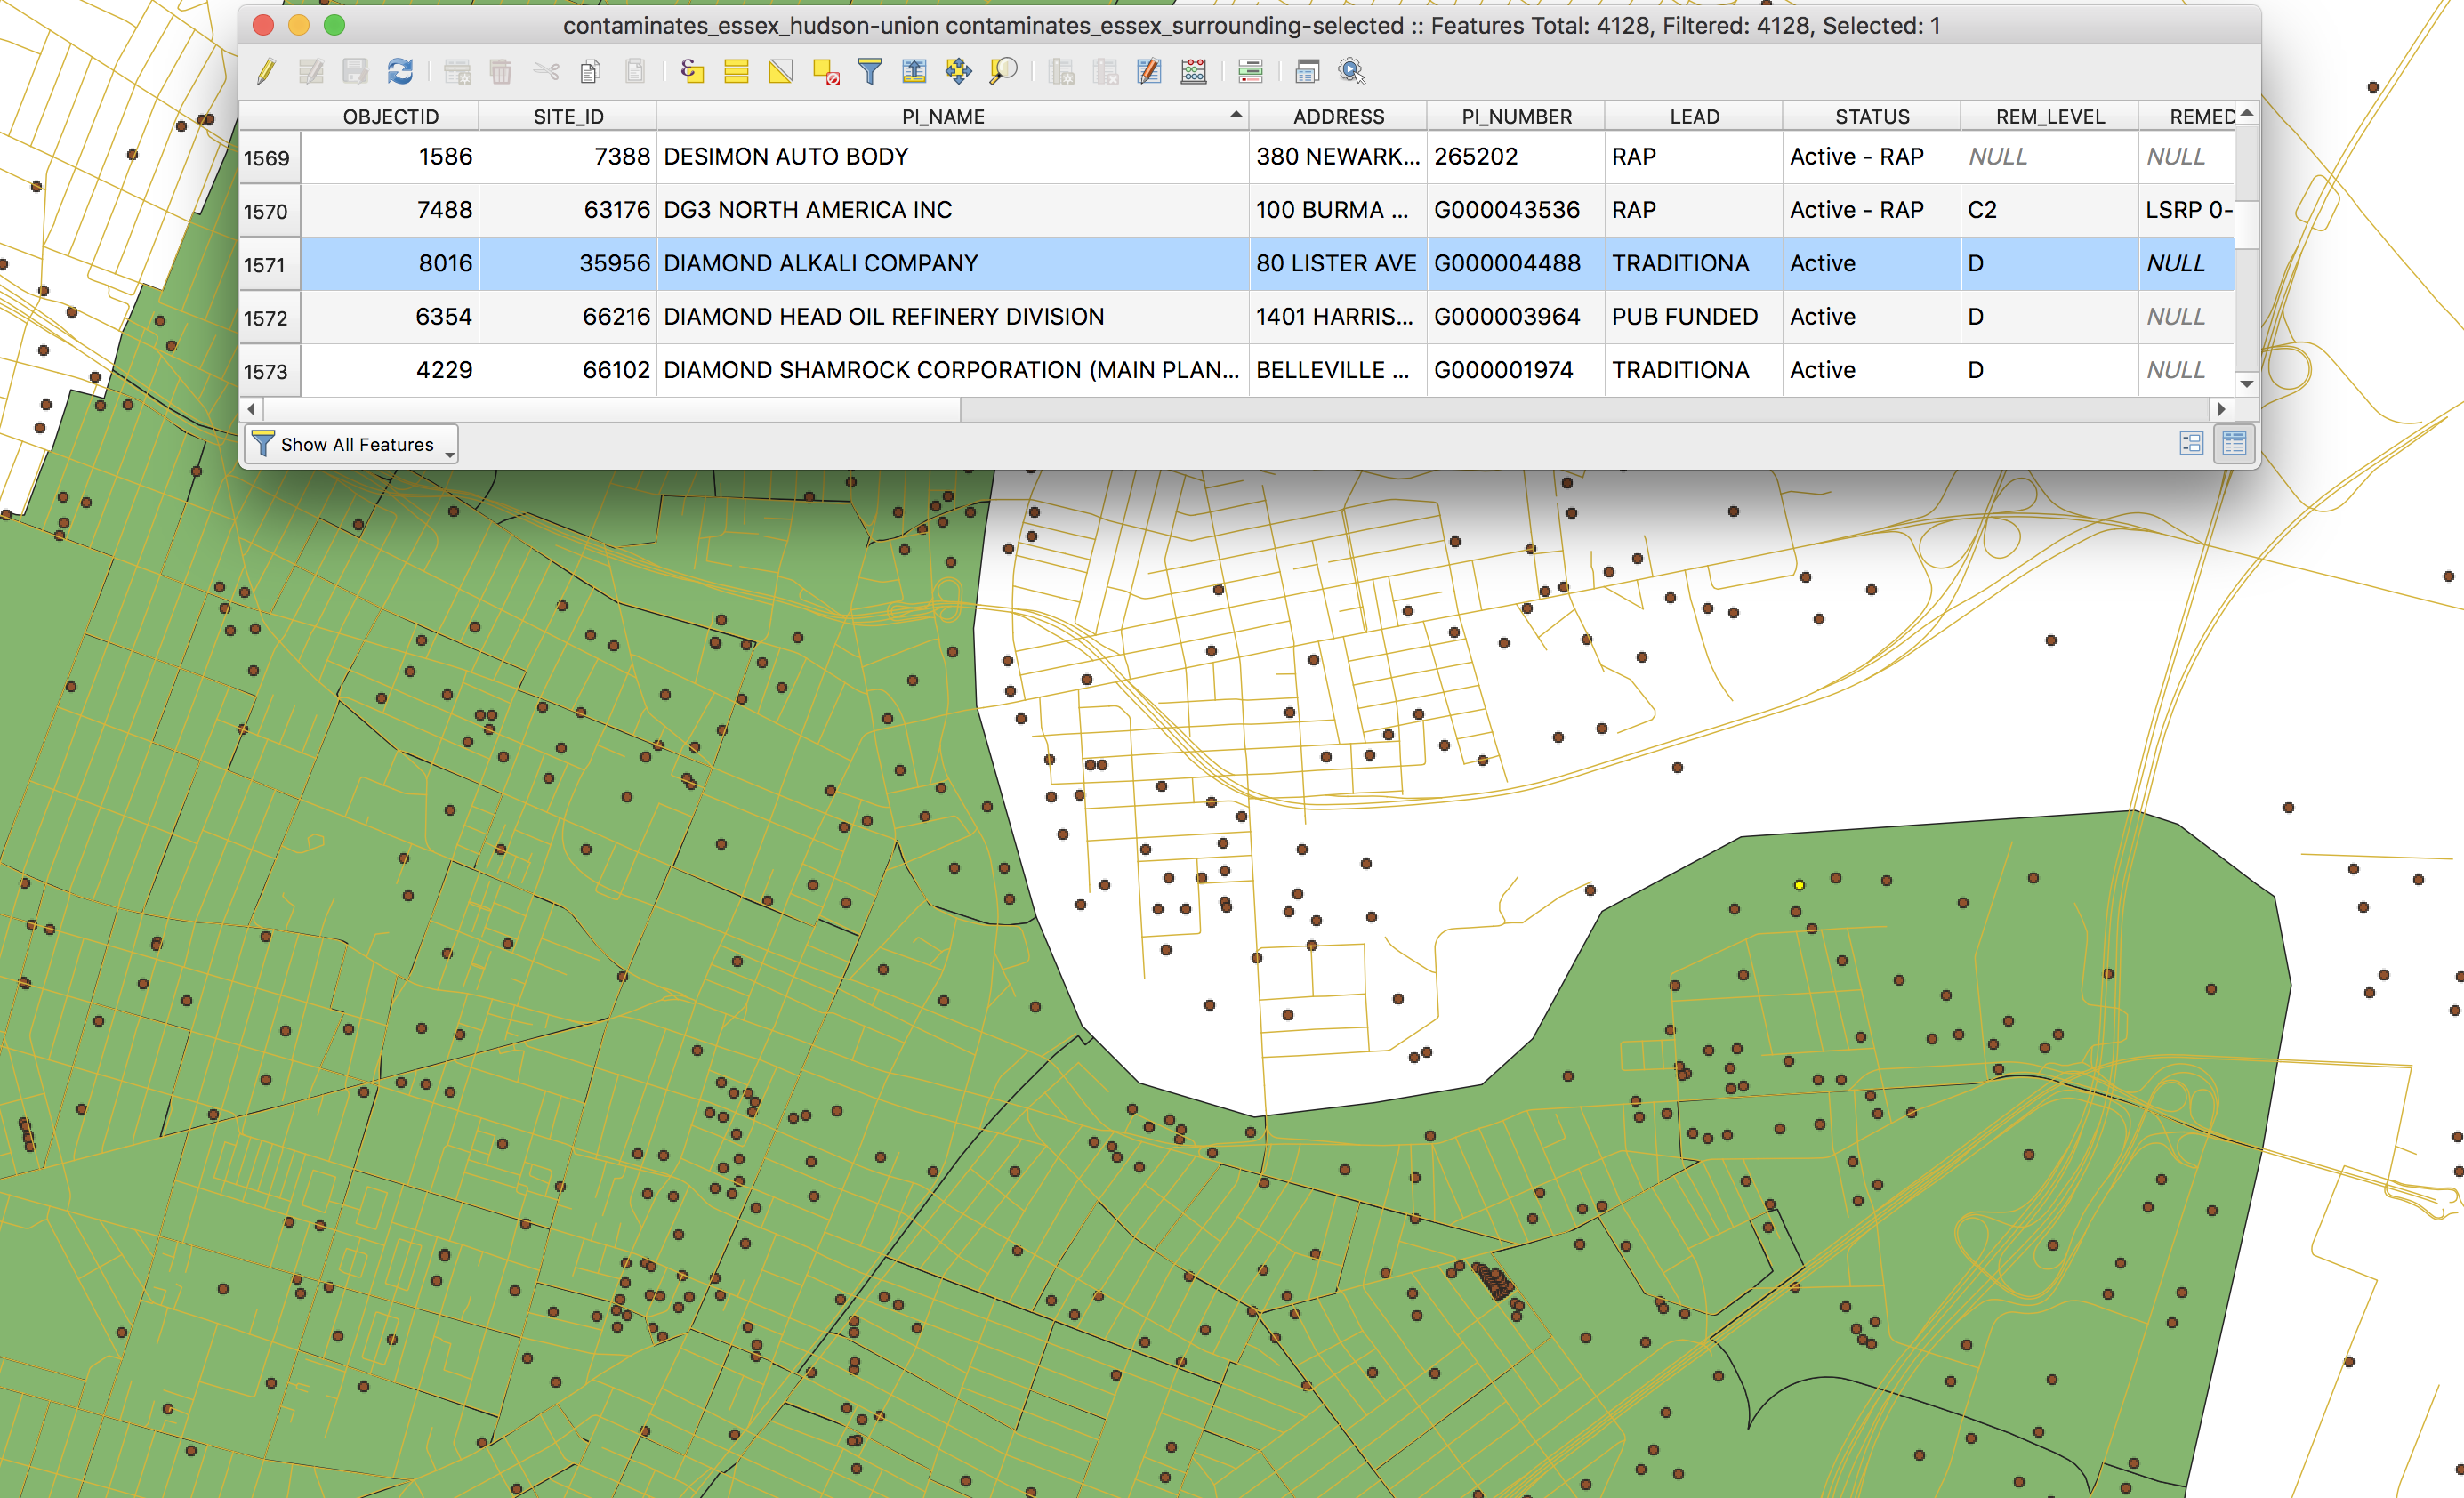
Save this point as a new geojson file. Click on the layer in the layers panel and then export selected to save a new dataset containing a single point feature for the Diamond Alkali Company site. Save it in the data folder for the project and give it a reasonable file name.
Now you will compute the Iso-Area around the site using QNEAT3 Iso-Area tool.
Open the Processing Toolbox (Under Processing>ProcessingToolbox in the top navigation menu).
Then scroll down to the QNEAT3 set of tools:
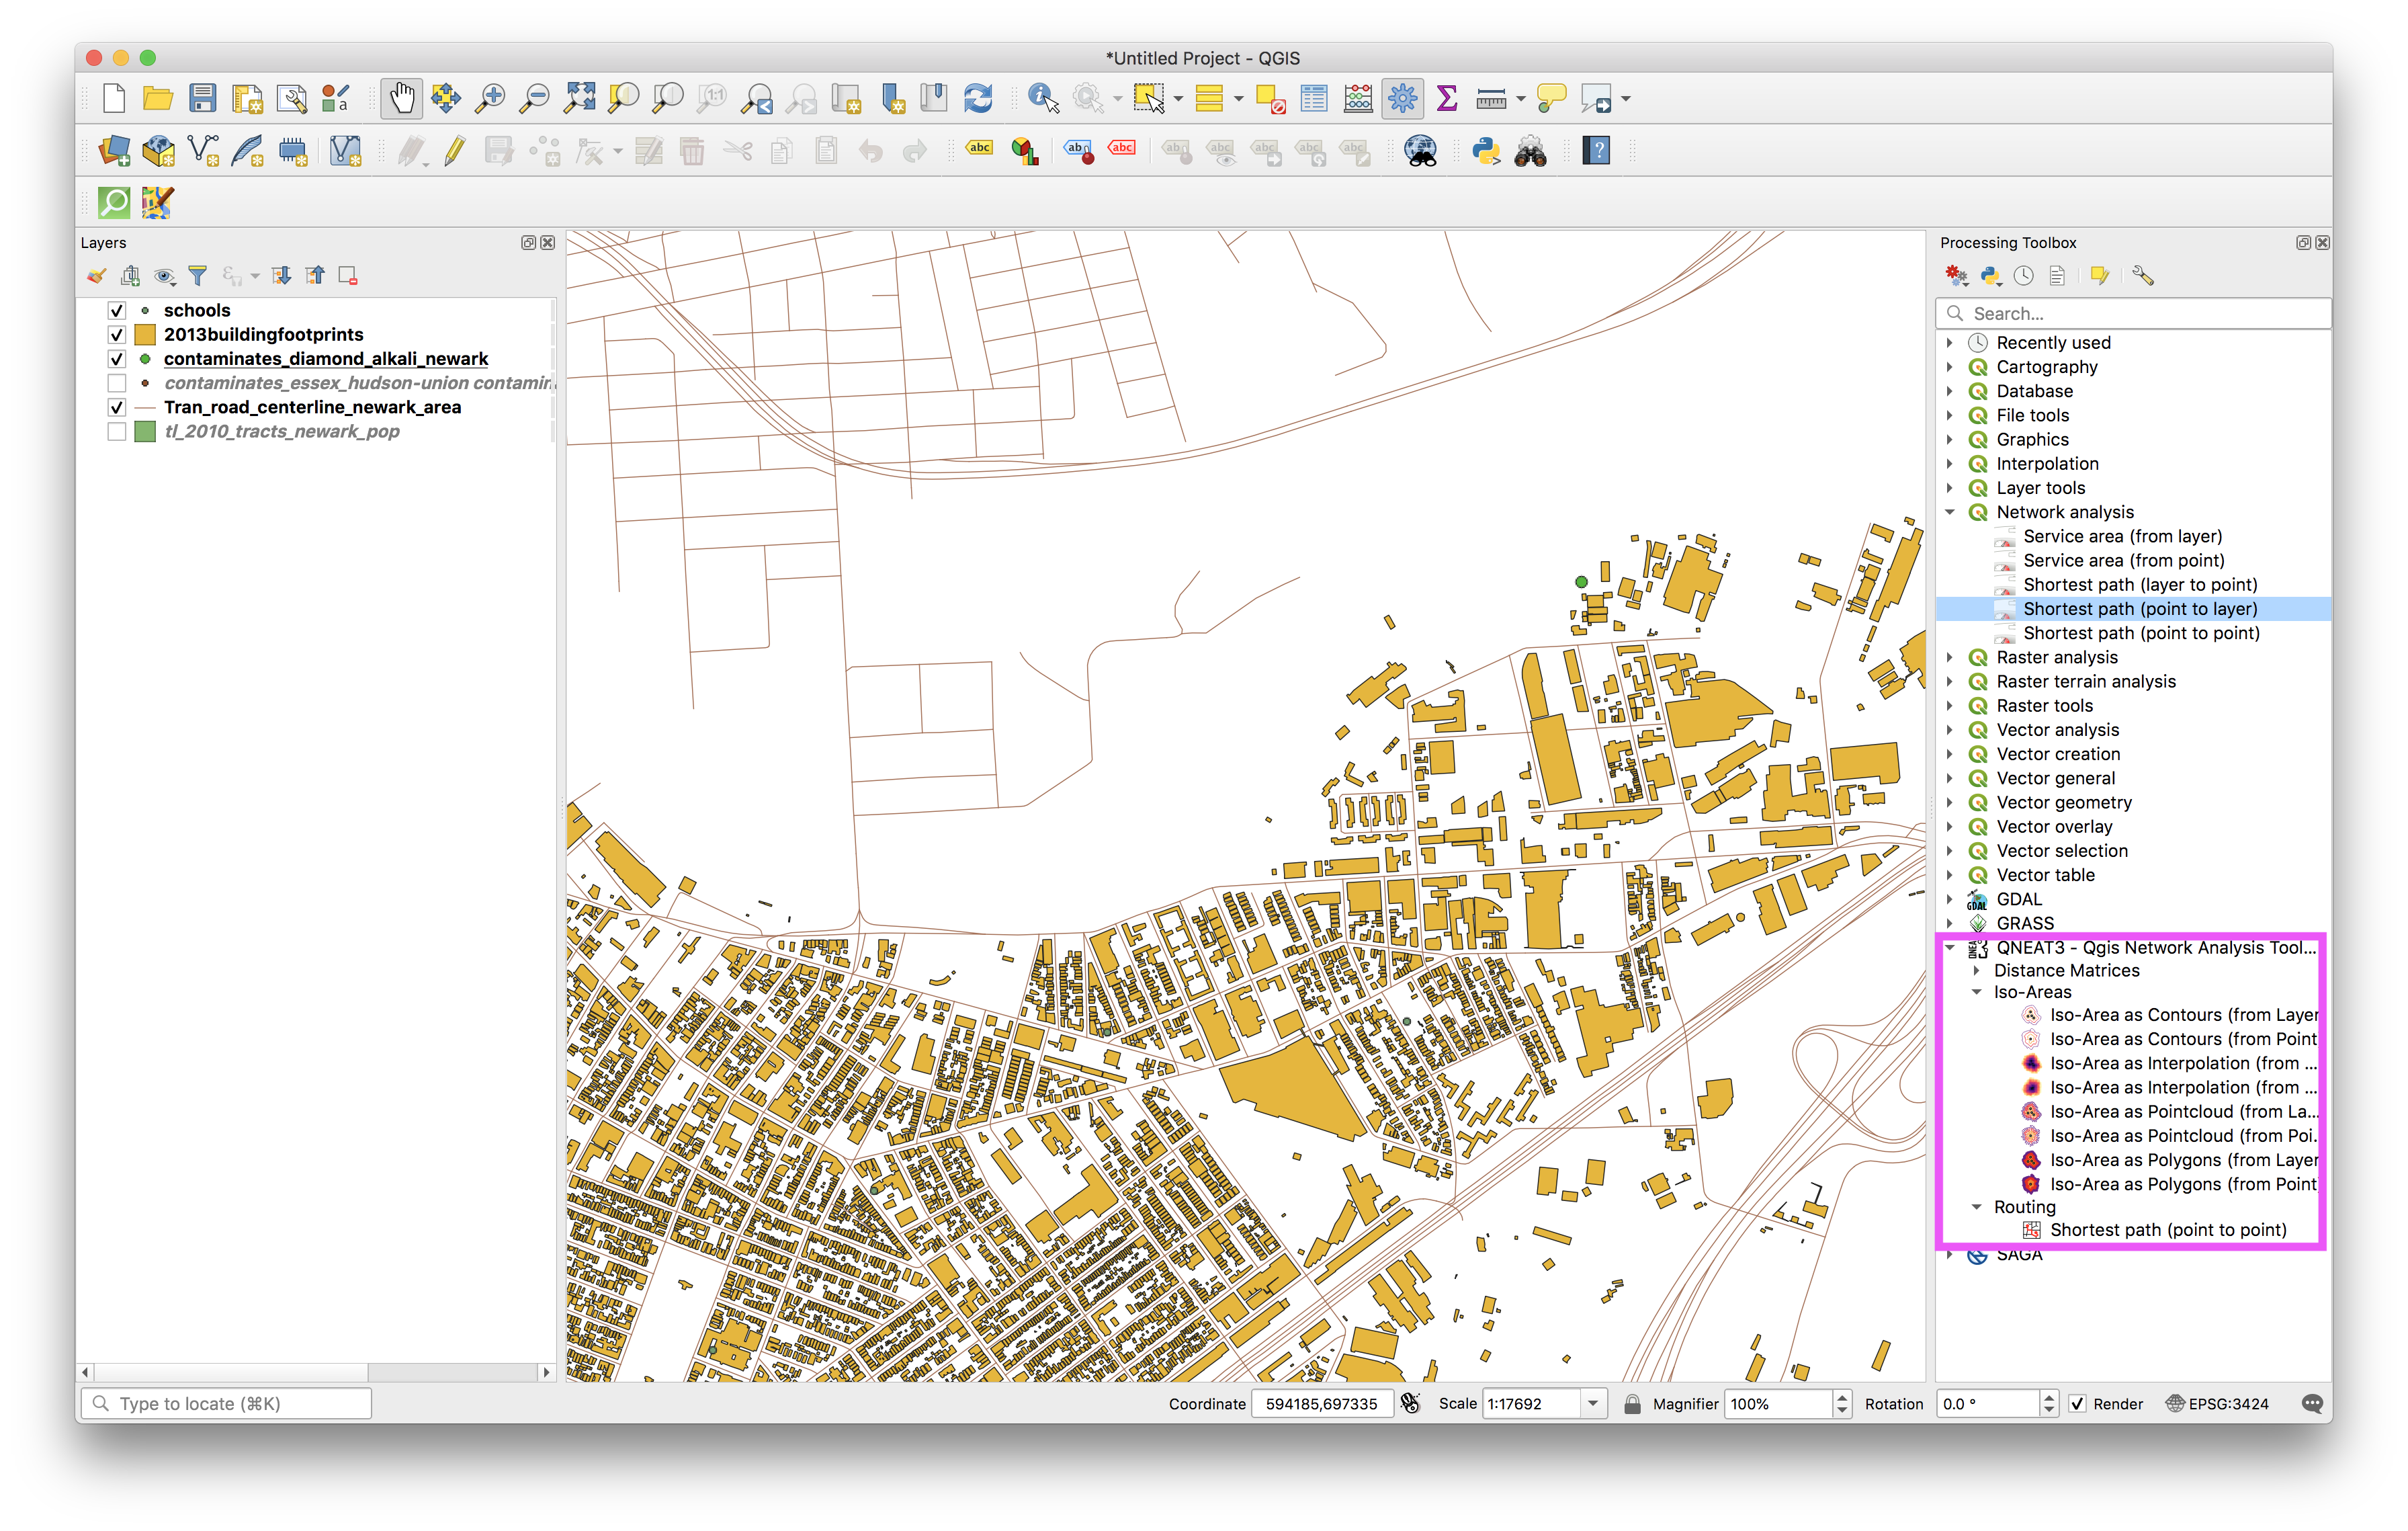 Click on the
 Iso-Area as Polygons (from Layer) tool. Make the selections shown below. Save the output polygon layer as diamond_quart_iso-area.geojson within in the Processed folder within the data folder for this assignment.
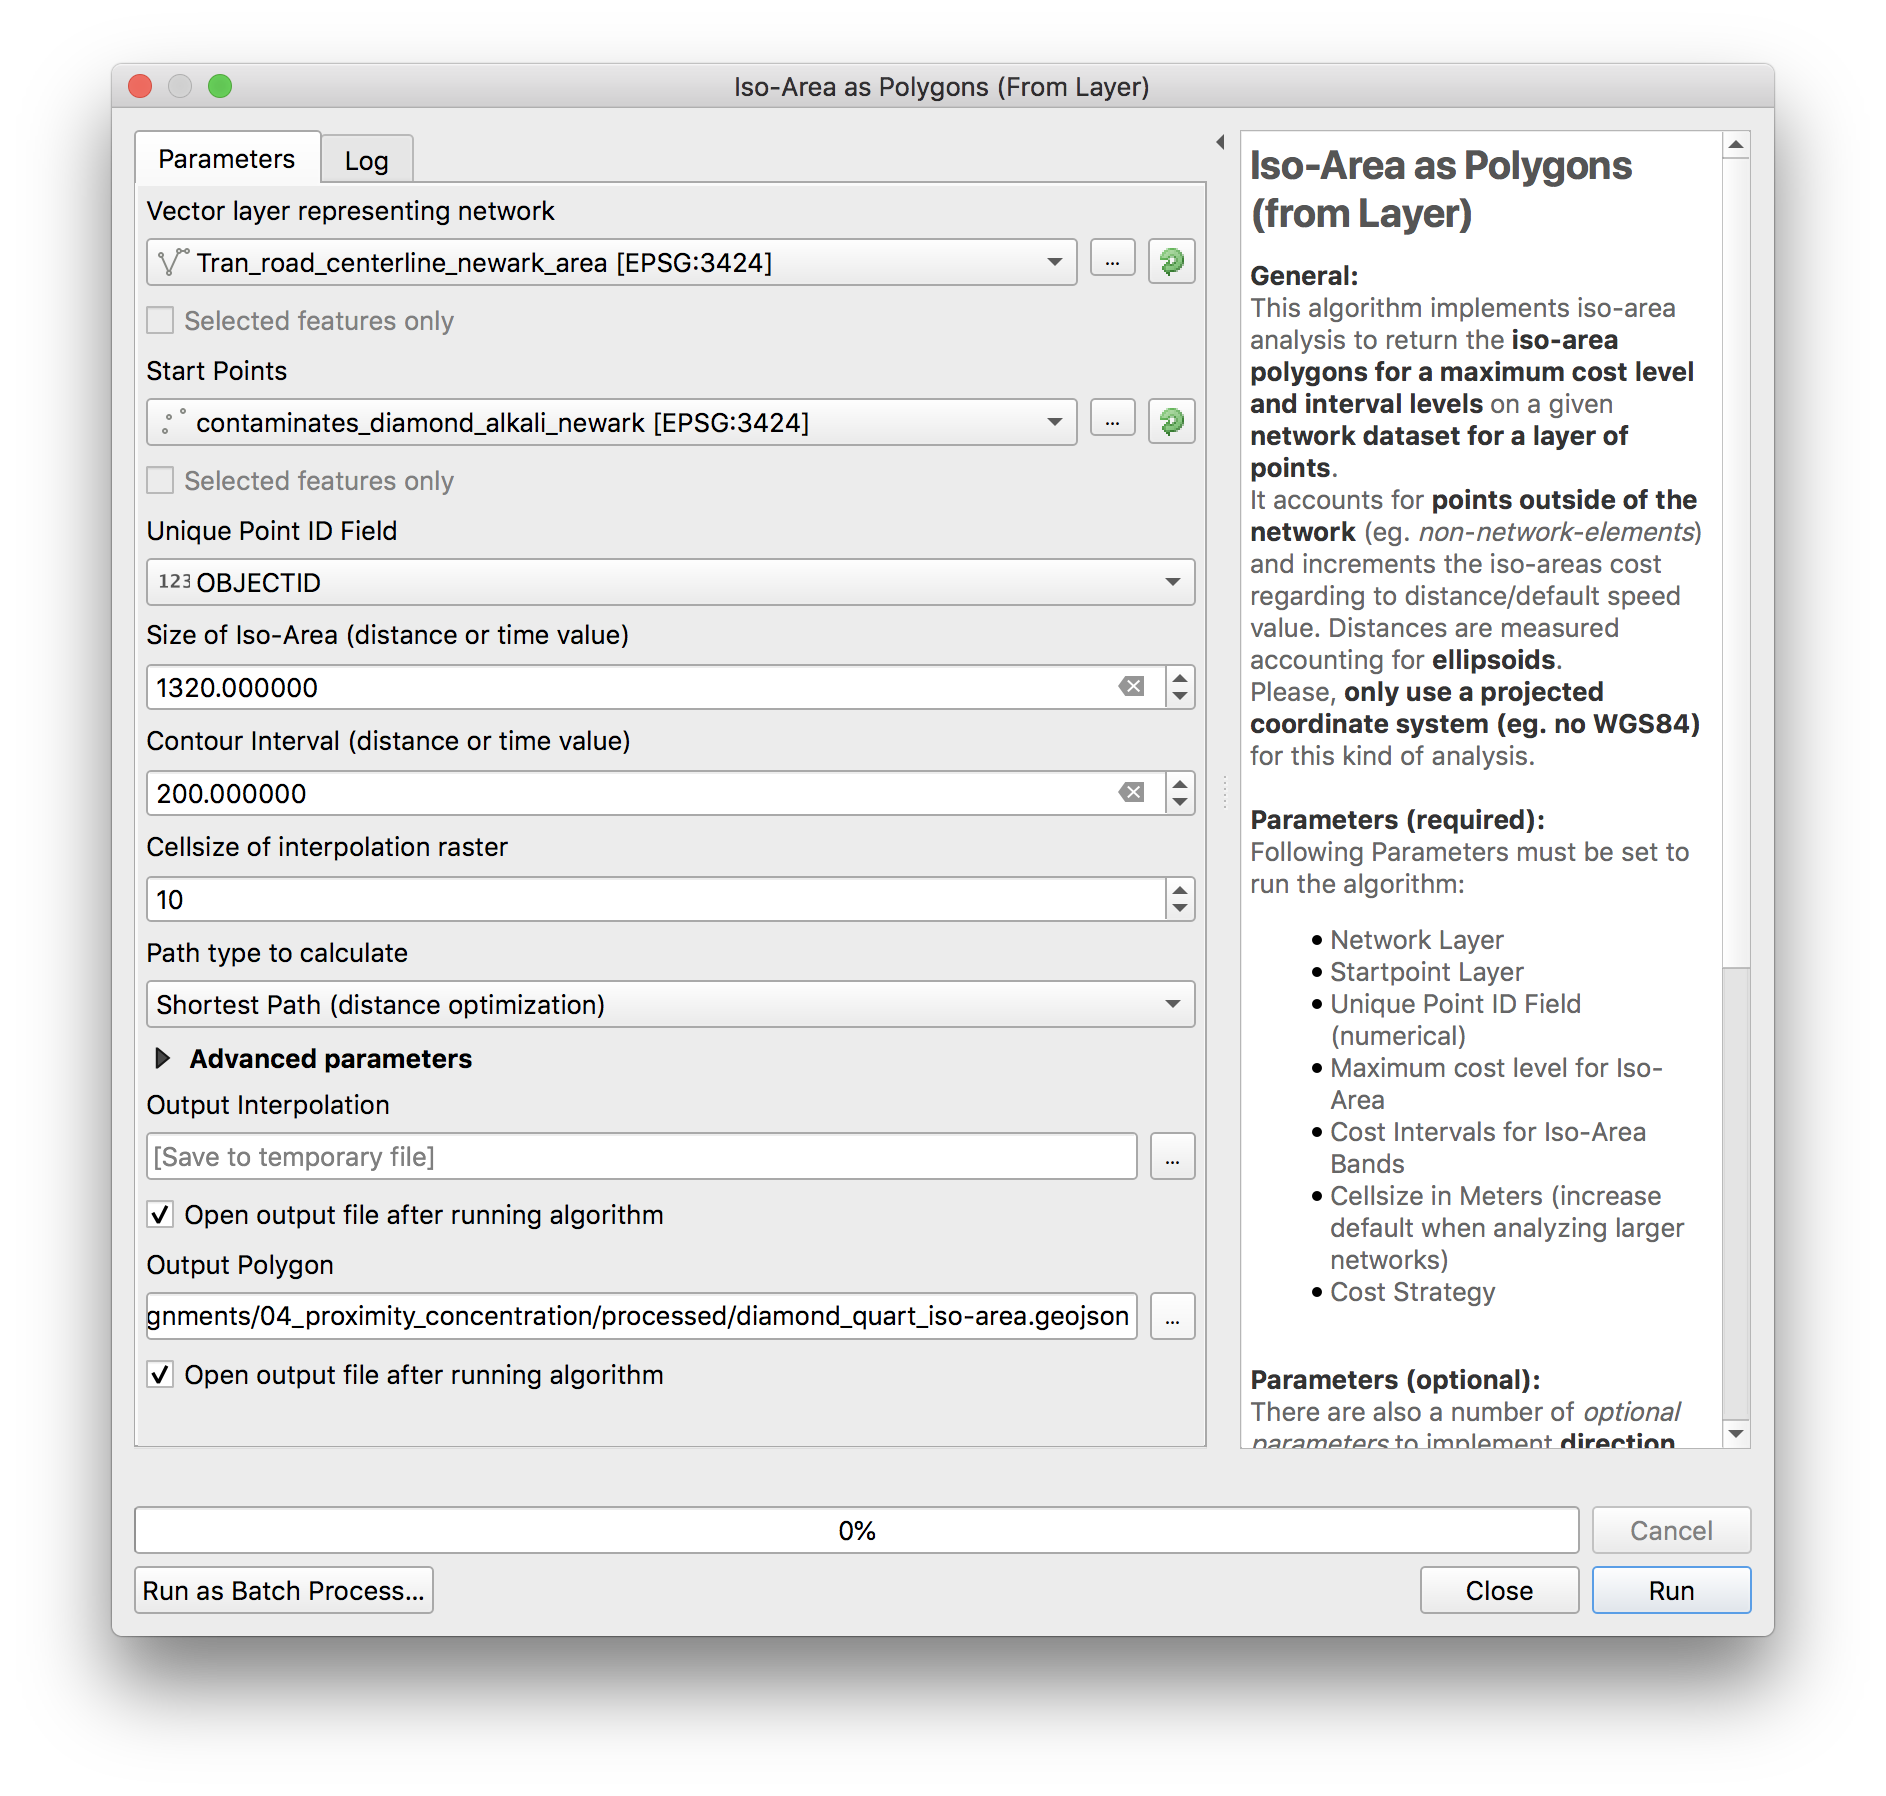 Click
Click Run. The network analysis algorithm should begin processing. This may take a few minutes.
Once it as completed you will see two new layers added to your map.
If it isn’t already move the iso-area polygons on top of the interpolation raster.
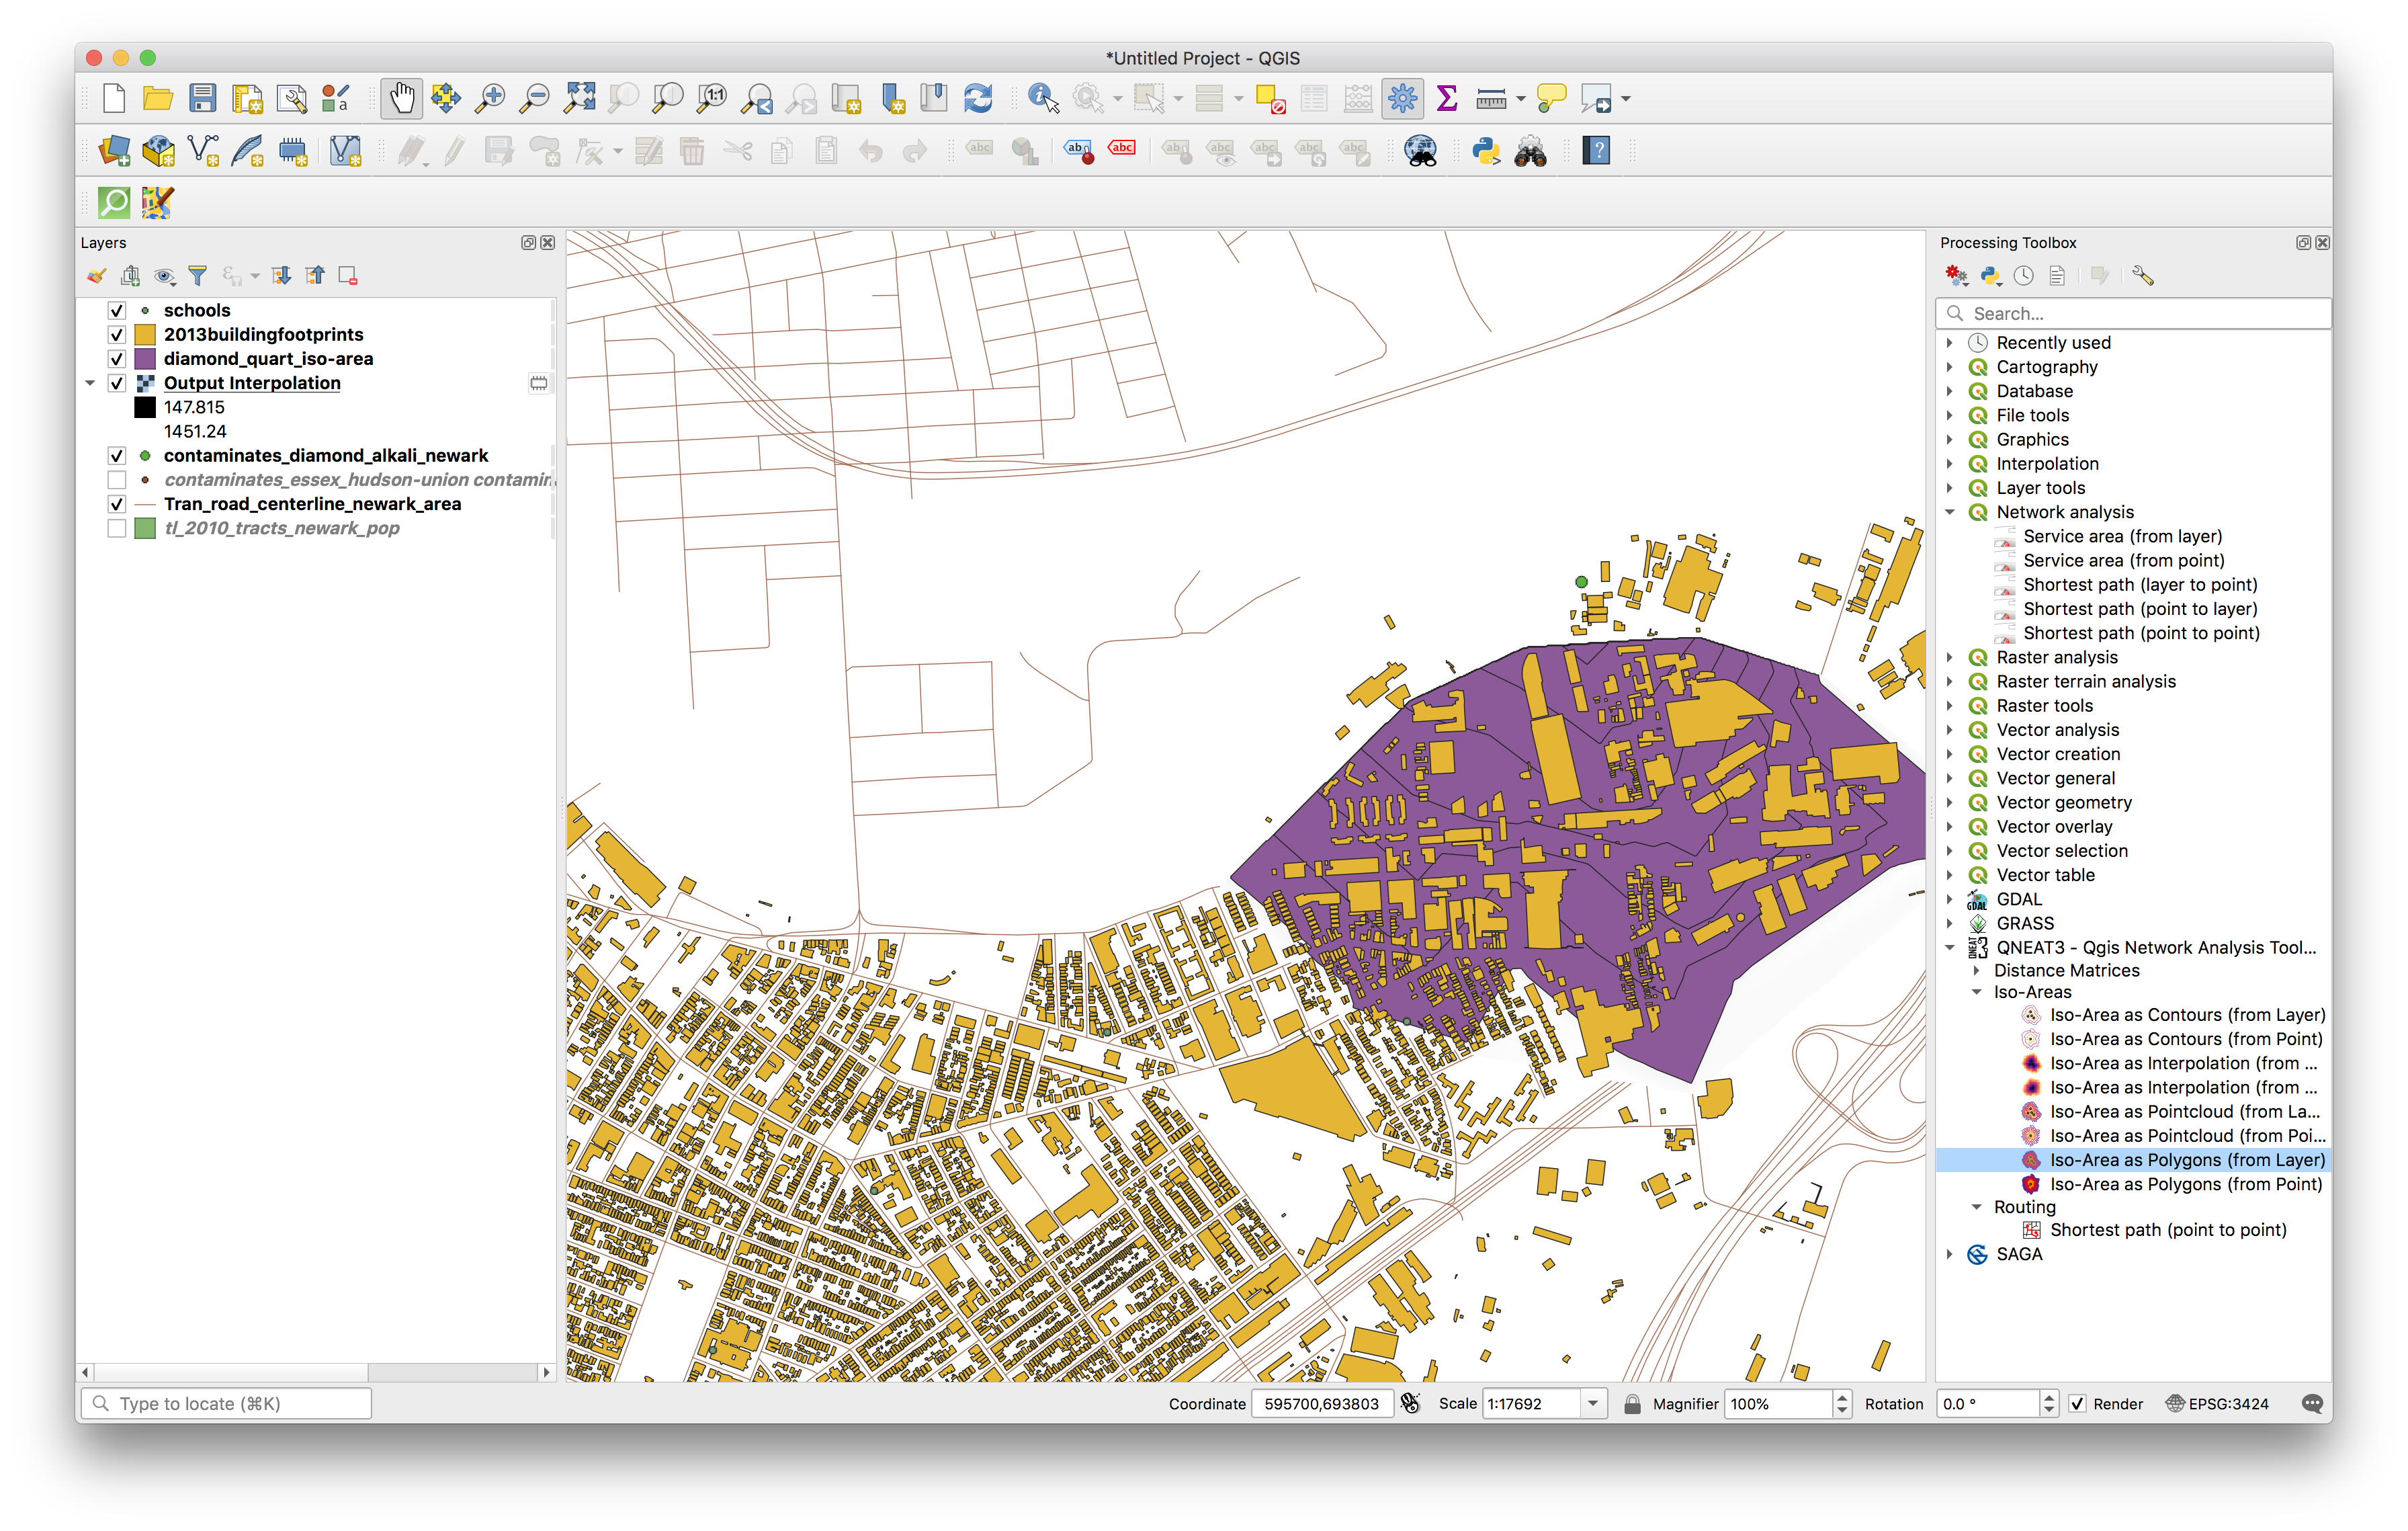 These polygons represent the area that is reachable by traveling 1/4 mile on roads from the Diamond Alkali Company site.
Now for the final component of the methodology to answer How many buildings are within 1/4 mile on the ground walking distance of the Diamond Alkali Company superfund site?
Use select by location to select the Newark buildings that fall within 1/4 mile Iso-Area from the site. How many buildings are there?
Shortest distance from Diamond Alkali Company to Schools
Our second question is: What are the shortest path distances from the site to each school in Newark?
You will use the shortest path (point to layer) tool to answer this question:
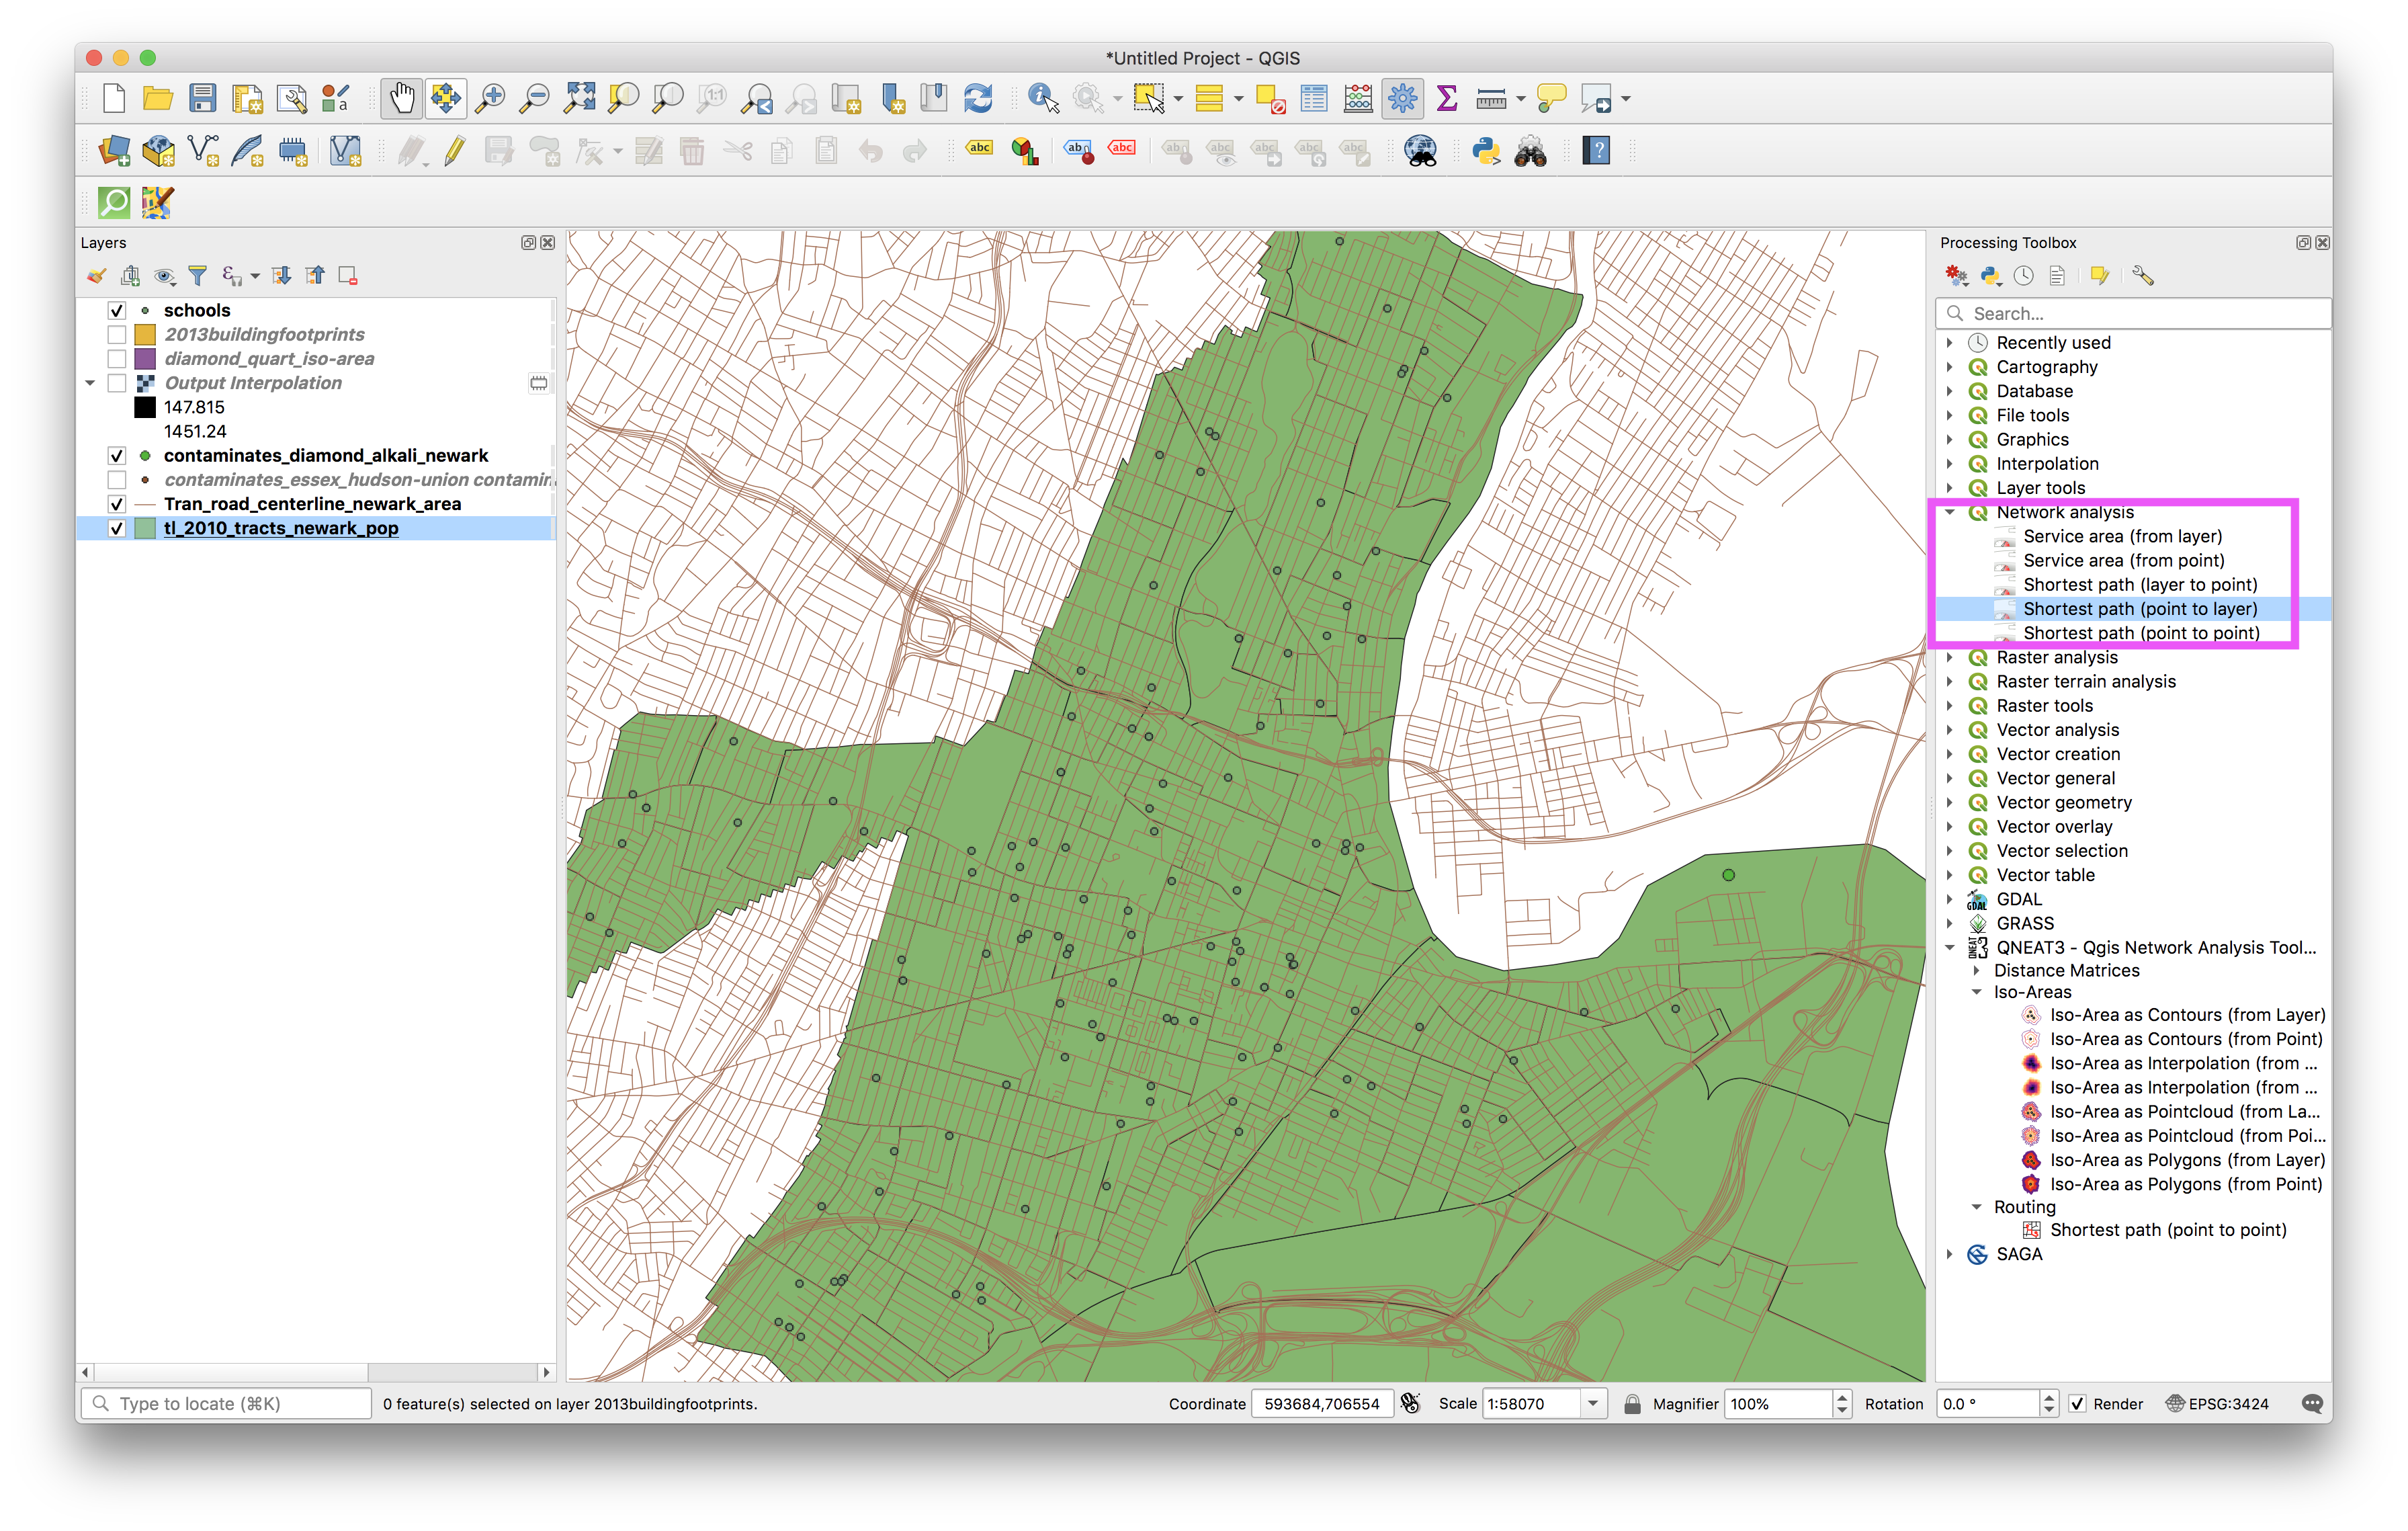
This tool is one of the built in network analysis tools that comes with QGIS3.10.
Make the following selections:
The results should look like this:
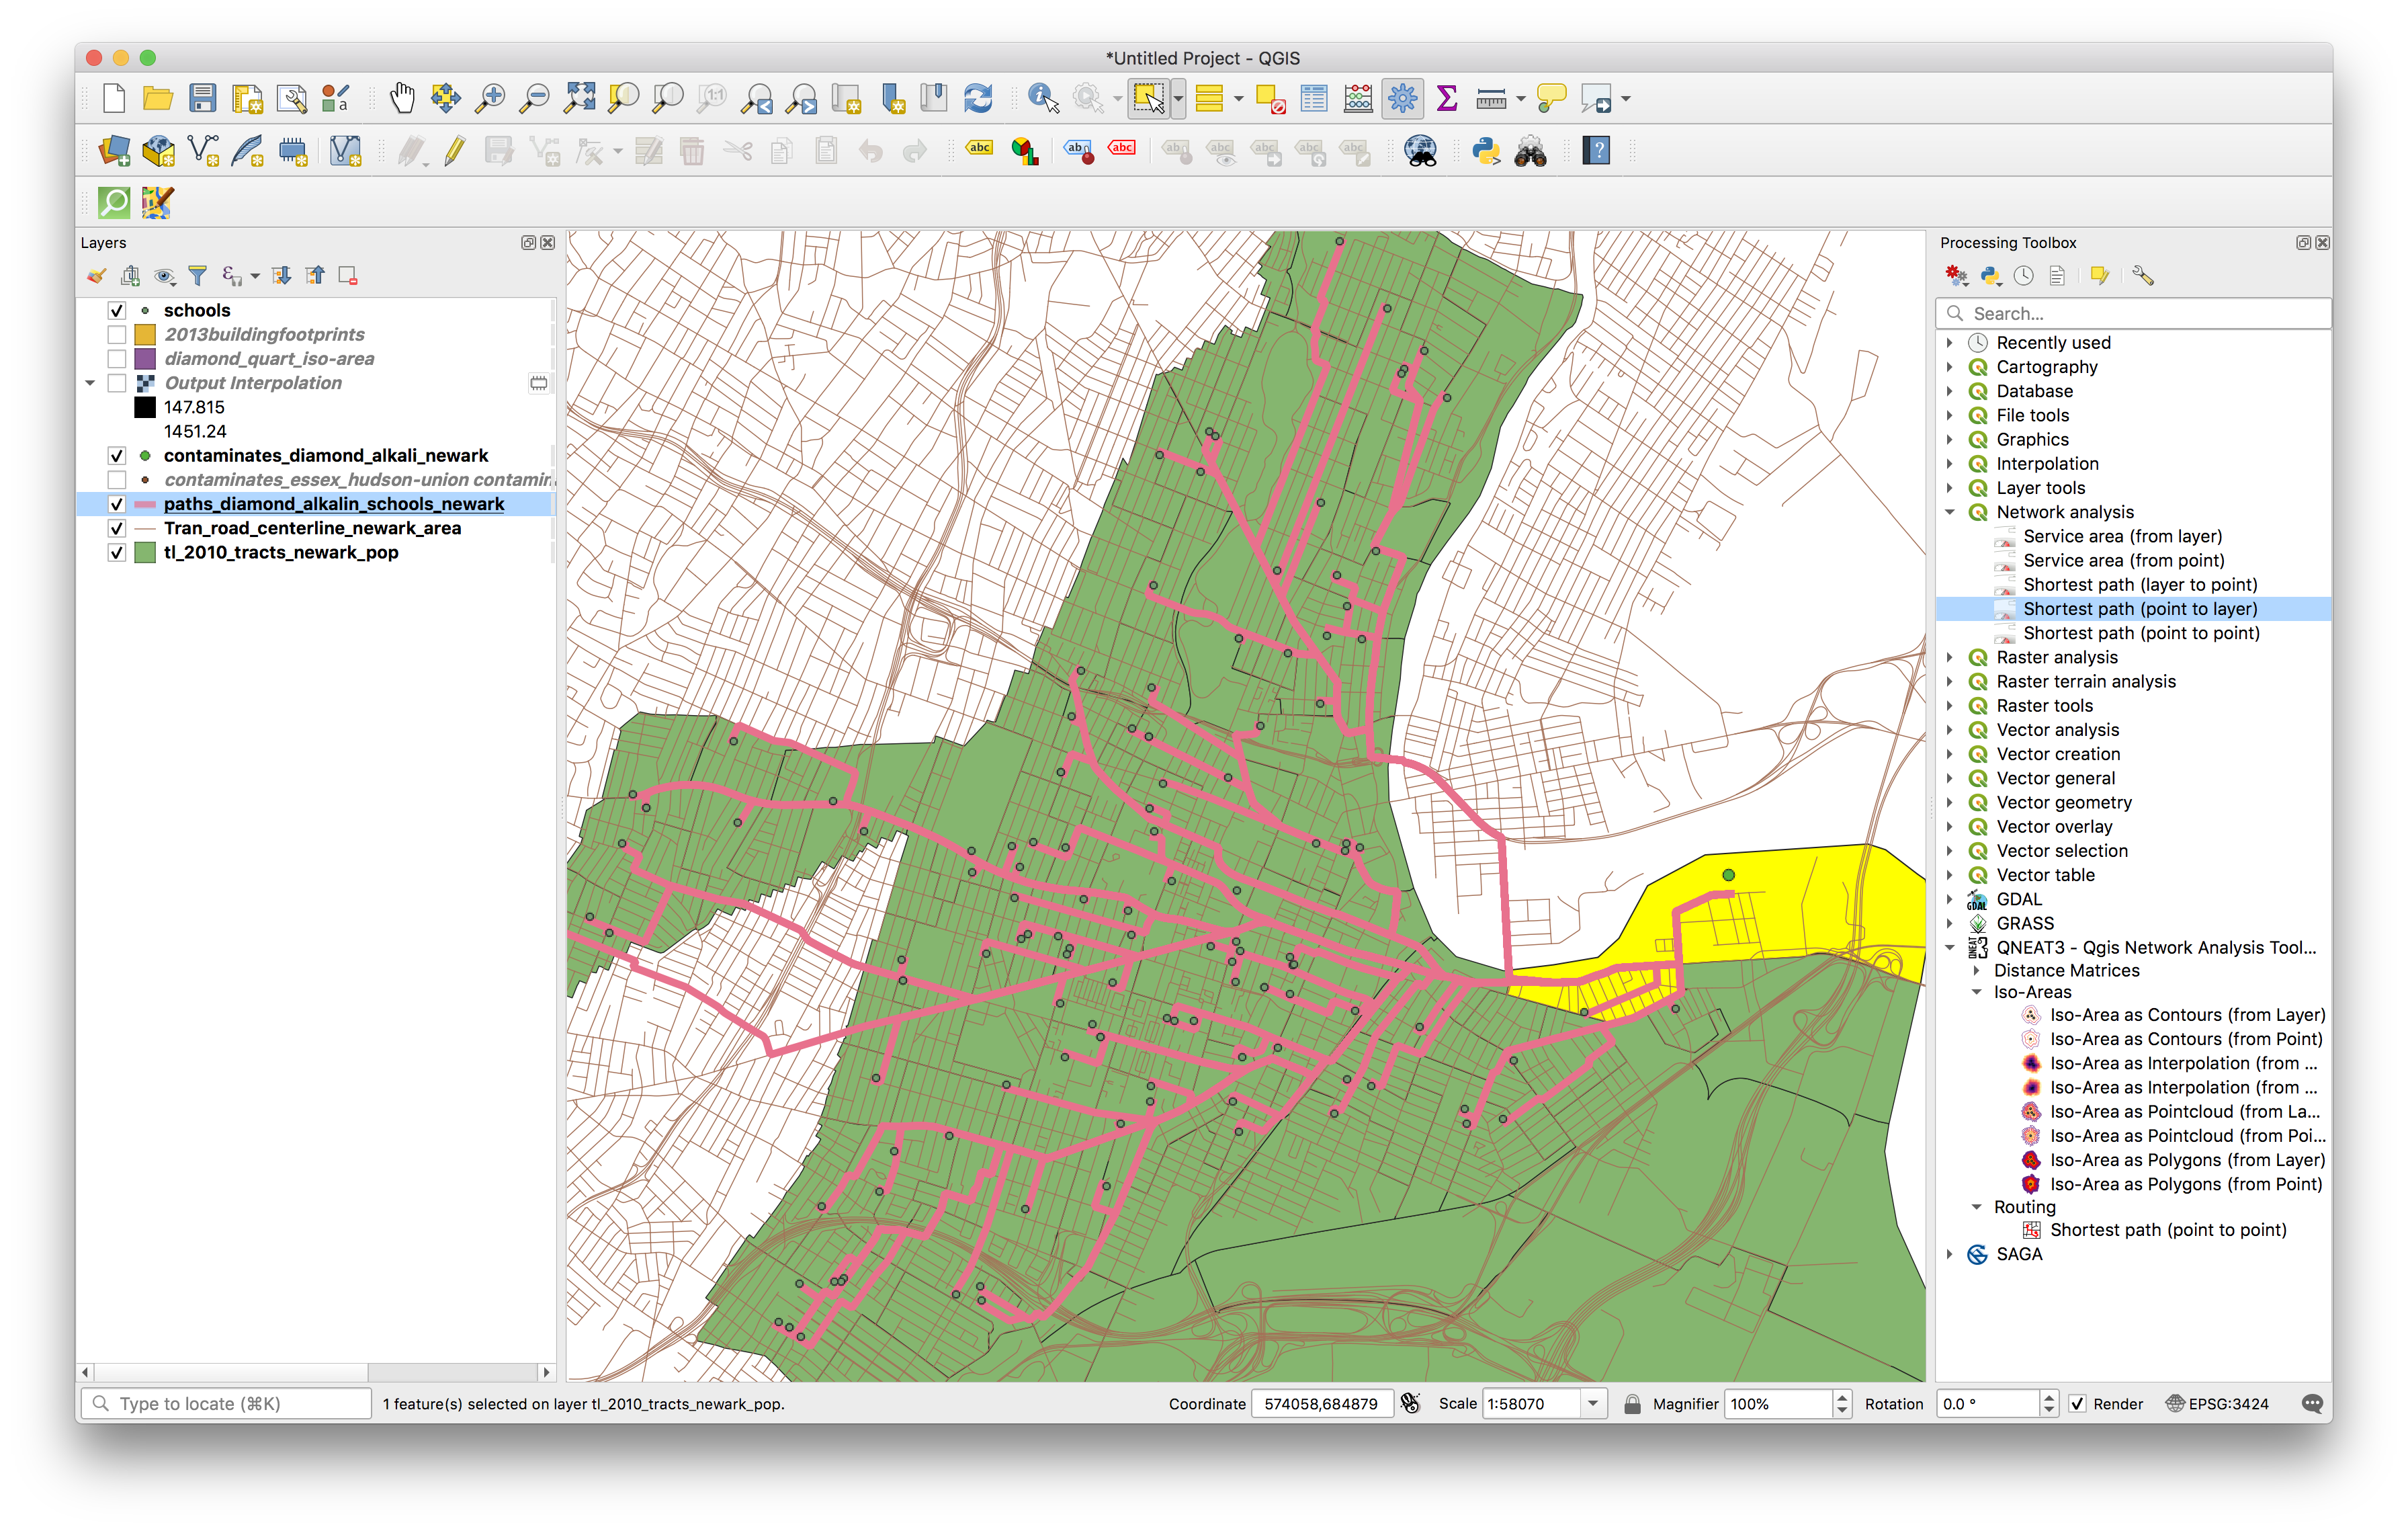
Upload a screenshot of the results with your submission on Canvas (this does not need to be a designed map composition but should show the shortest path routes clearly).