Assignment 01 mapping where things are
Due: September 23, 2020
This assignment is an introduction to basic functions of working with vector spatial data in QGIS. As shown in the outline of the assignment below it consists of three parts.
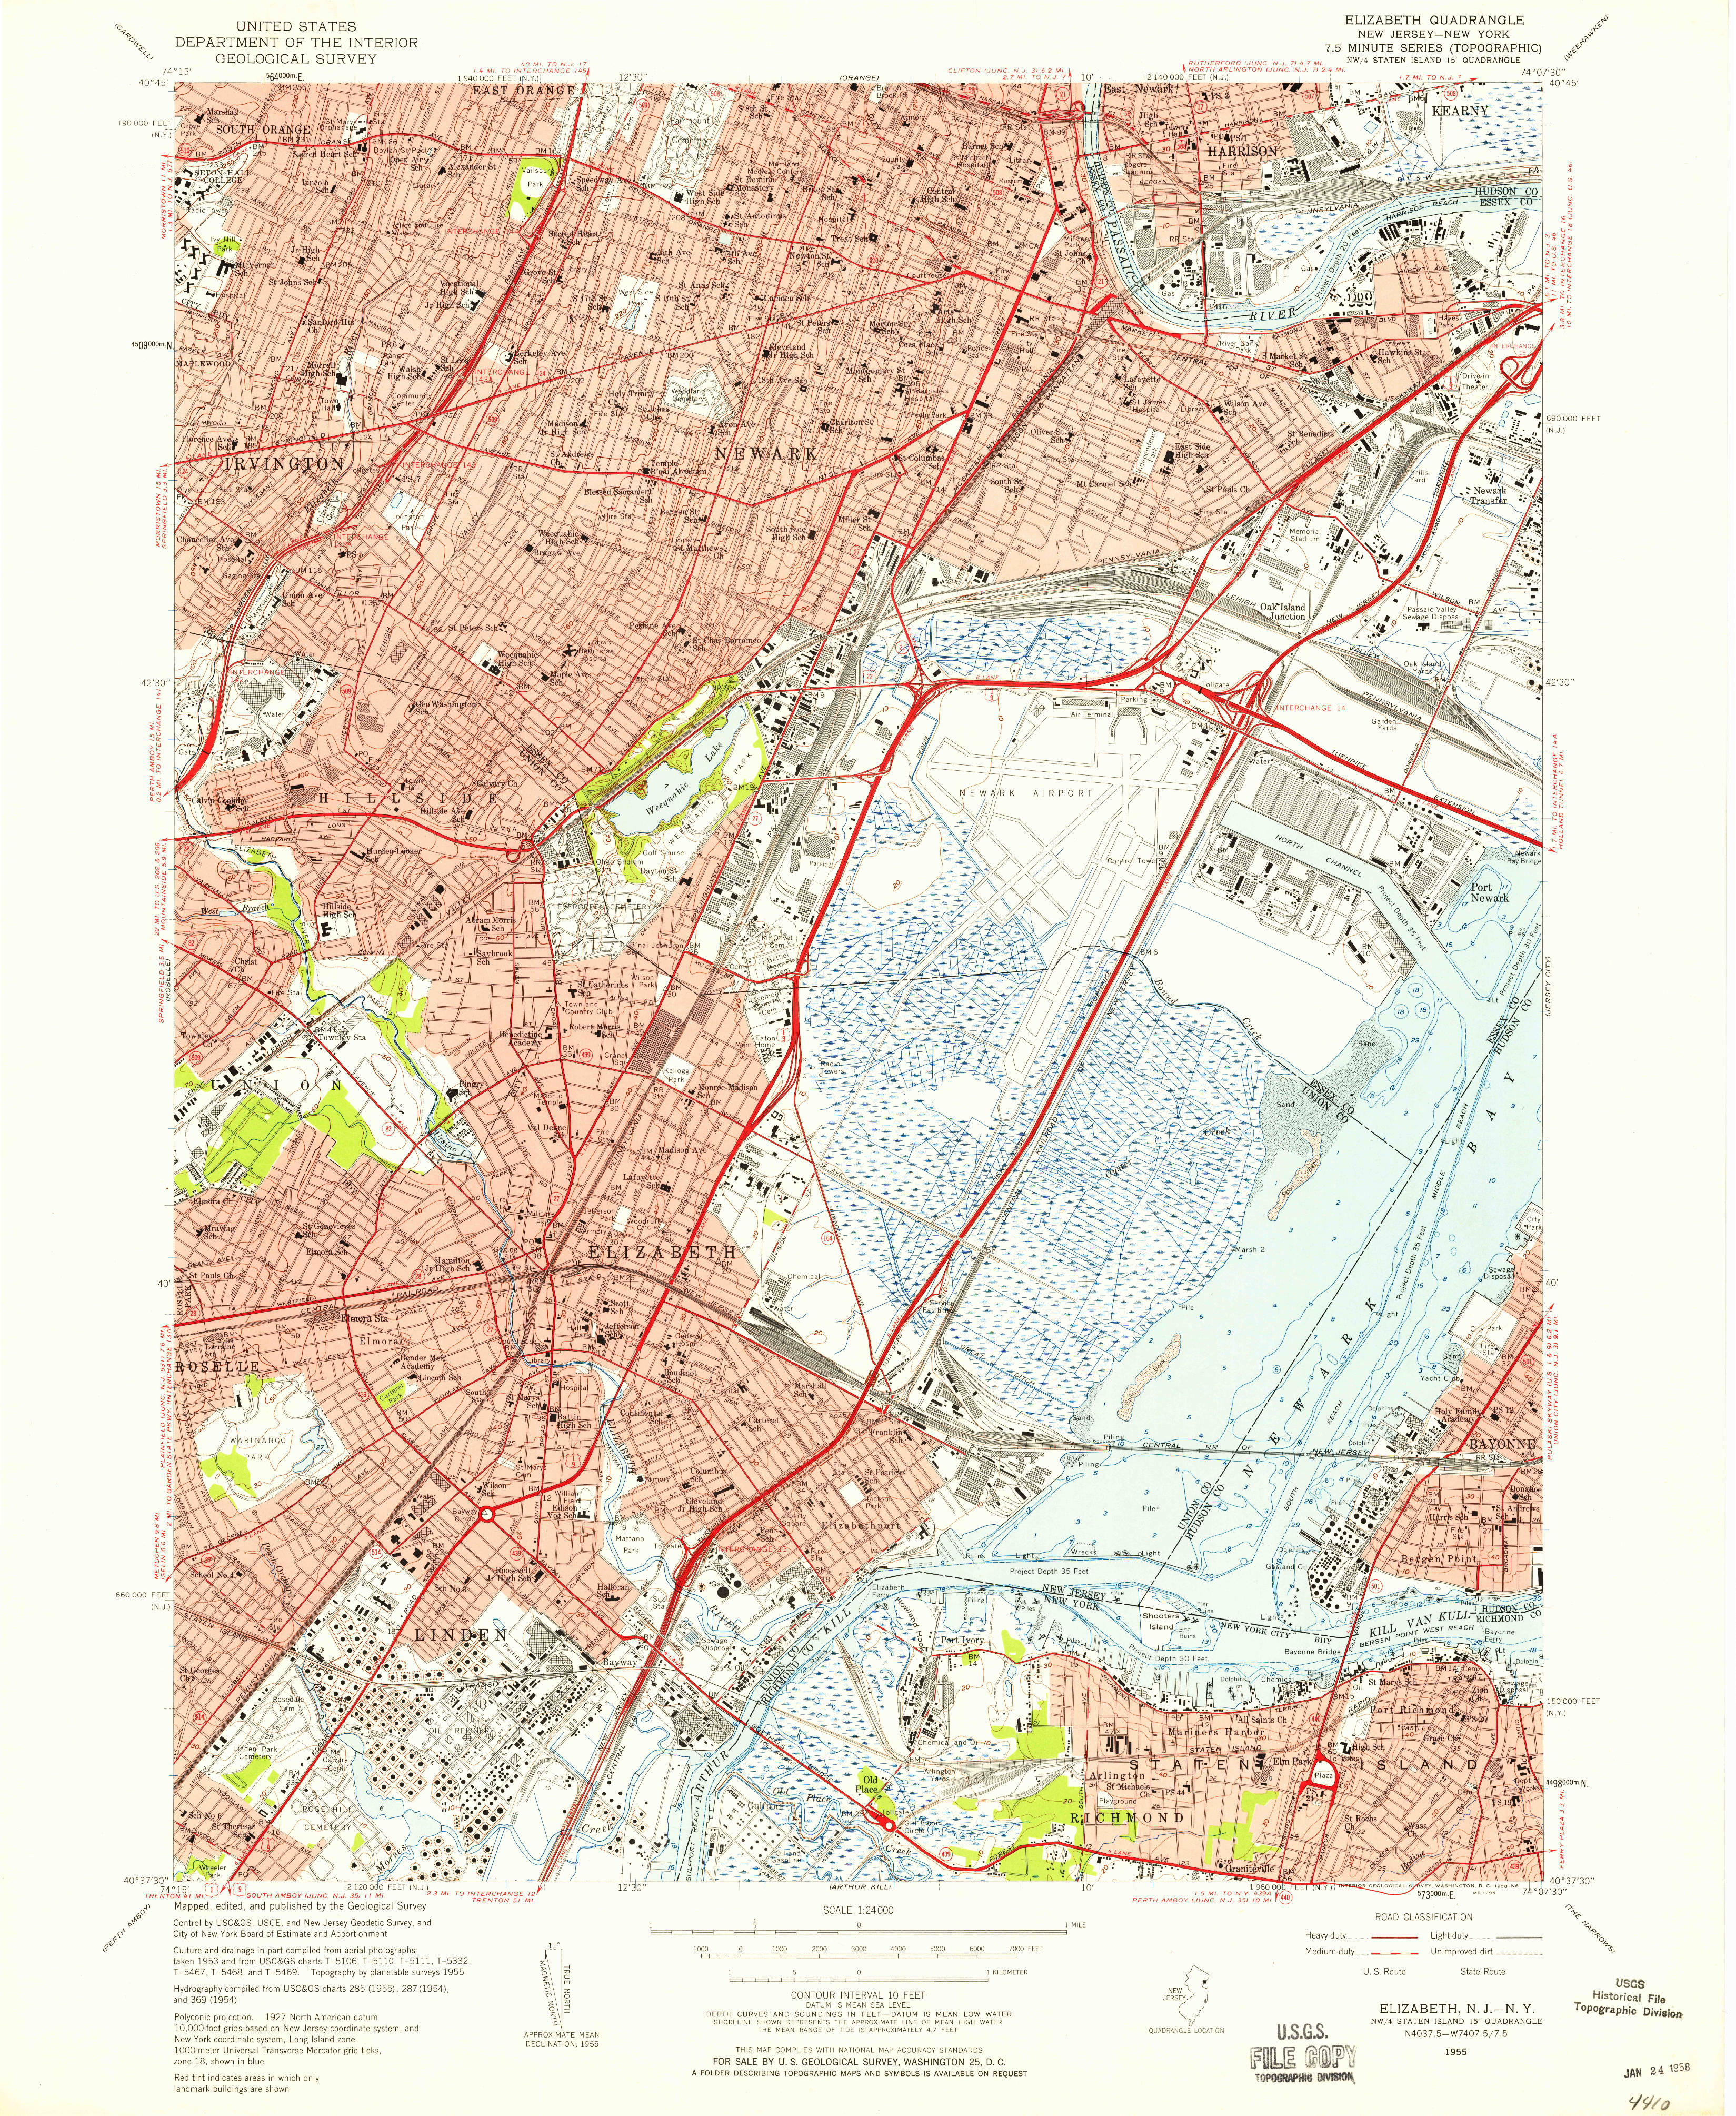
In part one you will explore property ownership in Newark through basic spatial and attribute queries. In part two you will become familiar with how to manipulate Coordinate reference systems in QGIS. And in part three you will learn basic elements of map layout in QGIS, and will be asked to design a map in the style of a USGS topographc series map (shown above).
Deliverables required for the assignment are outlined below.
- Assignment 01 mapping where things are
Assignment Deliverables
To receive credit and feedback on this project please upload the following to canvas by 9/23.
-
One map of Newark in the style of a USGS Topographic Map. Thoughtfully examine the mapping conventions used in the USGS maps and design a replica of one with your own graphic point of view. Maps must include basic contextual elements (legend, scale, north arrow, data citation) but may be playful or experimental in their graphic approach. Students are encouraged to pick one element from the USGS map and explore/expand on it. Pay attention to line weights, hierarchy of information, and the aesthetics. Students will share their maps at the start of class on 9/23. Before you begin this section review the example maps from the USGS. Sample maps are saved in the precedents folder on the course GoogleDrive, and also can be downloaded directly for an area you are interested in from the USGS here.
-
One .txt file containing answers to the following questions. Please use the format shown below:
Part 01- How many parcels list an owner address from outside Newark?
Your answer - How many parcels in Newark’s West Ward list an owner address from outside Newark?
Your answer - How many parcels in Newark’s North Ward list an owner address from outside Newark?
Your answer - How many properties marked as vacant in the 2017 vacancy survey are located on parcels where the owner’s address is outside Newark?
Your answer Bonus question: what percentage of the total vacant parcels included in the survey is this?
Your answer
Part 03
Notice the differences between the grid and the graticule. Based on our discussion of projections can you interpret these differences? Supply 2-3 sentence answer. - How many parcels list an owner address from outside Newark?
File names should follow this naming convention exactly:
lastname_firstname_assignment01
Part 01: adding data
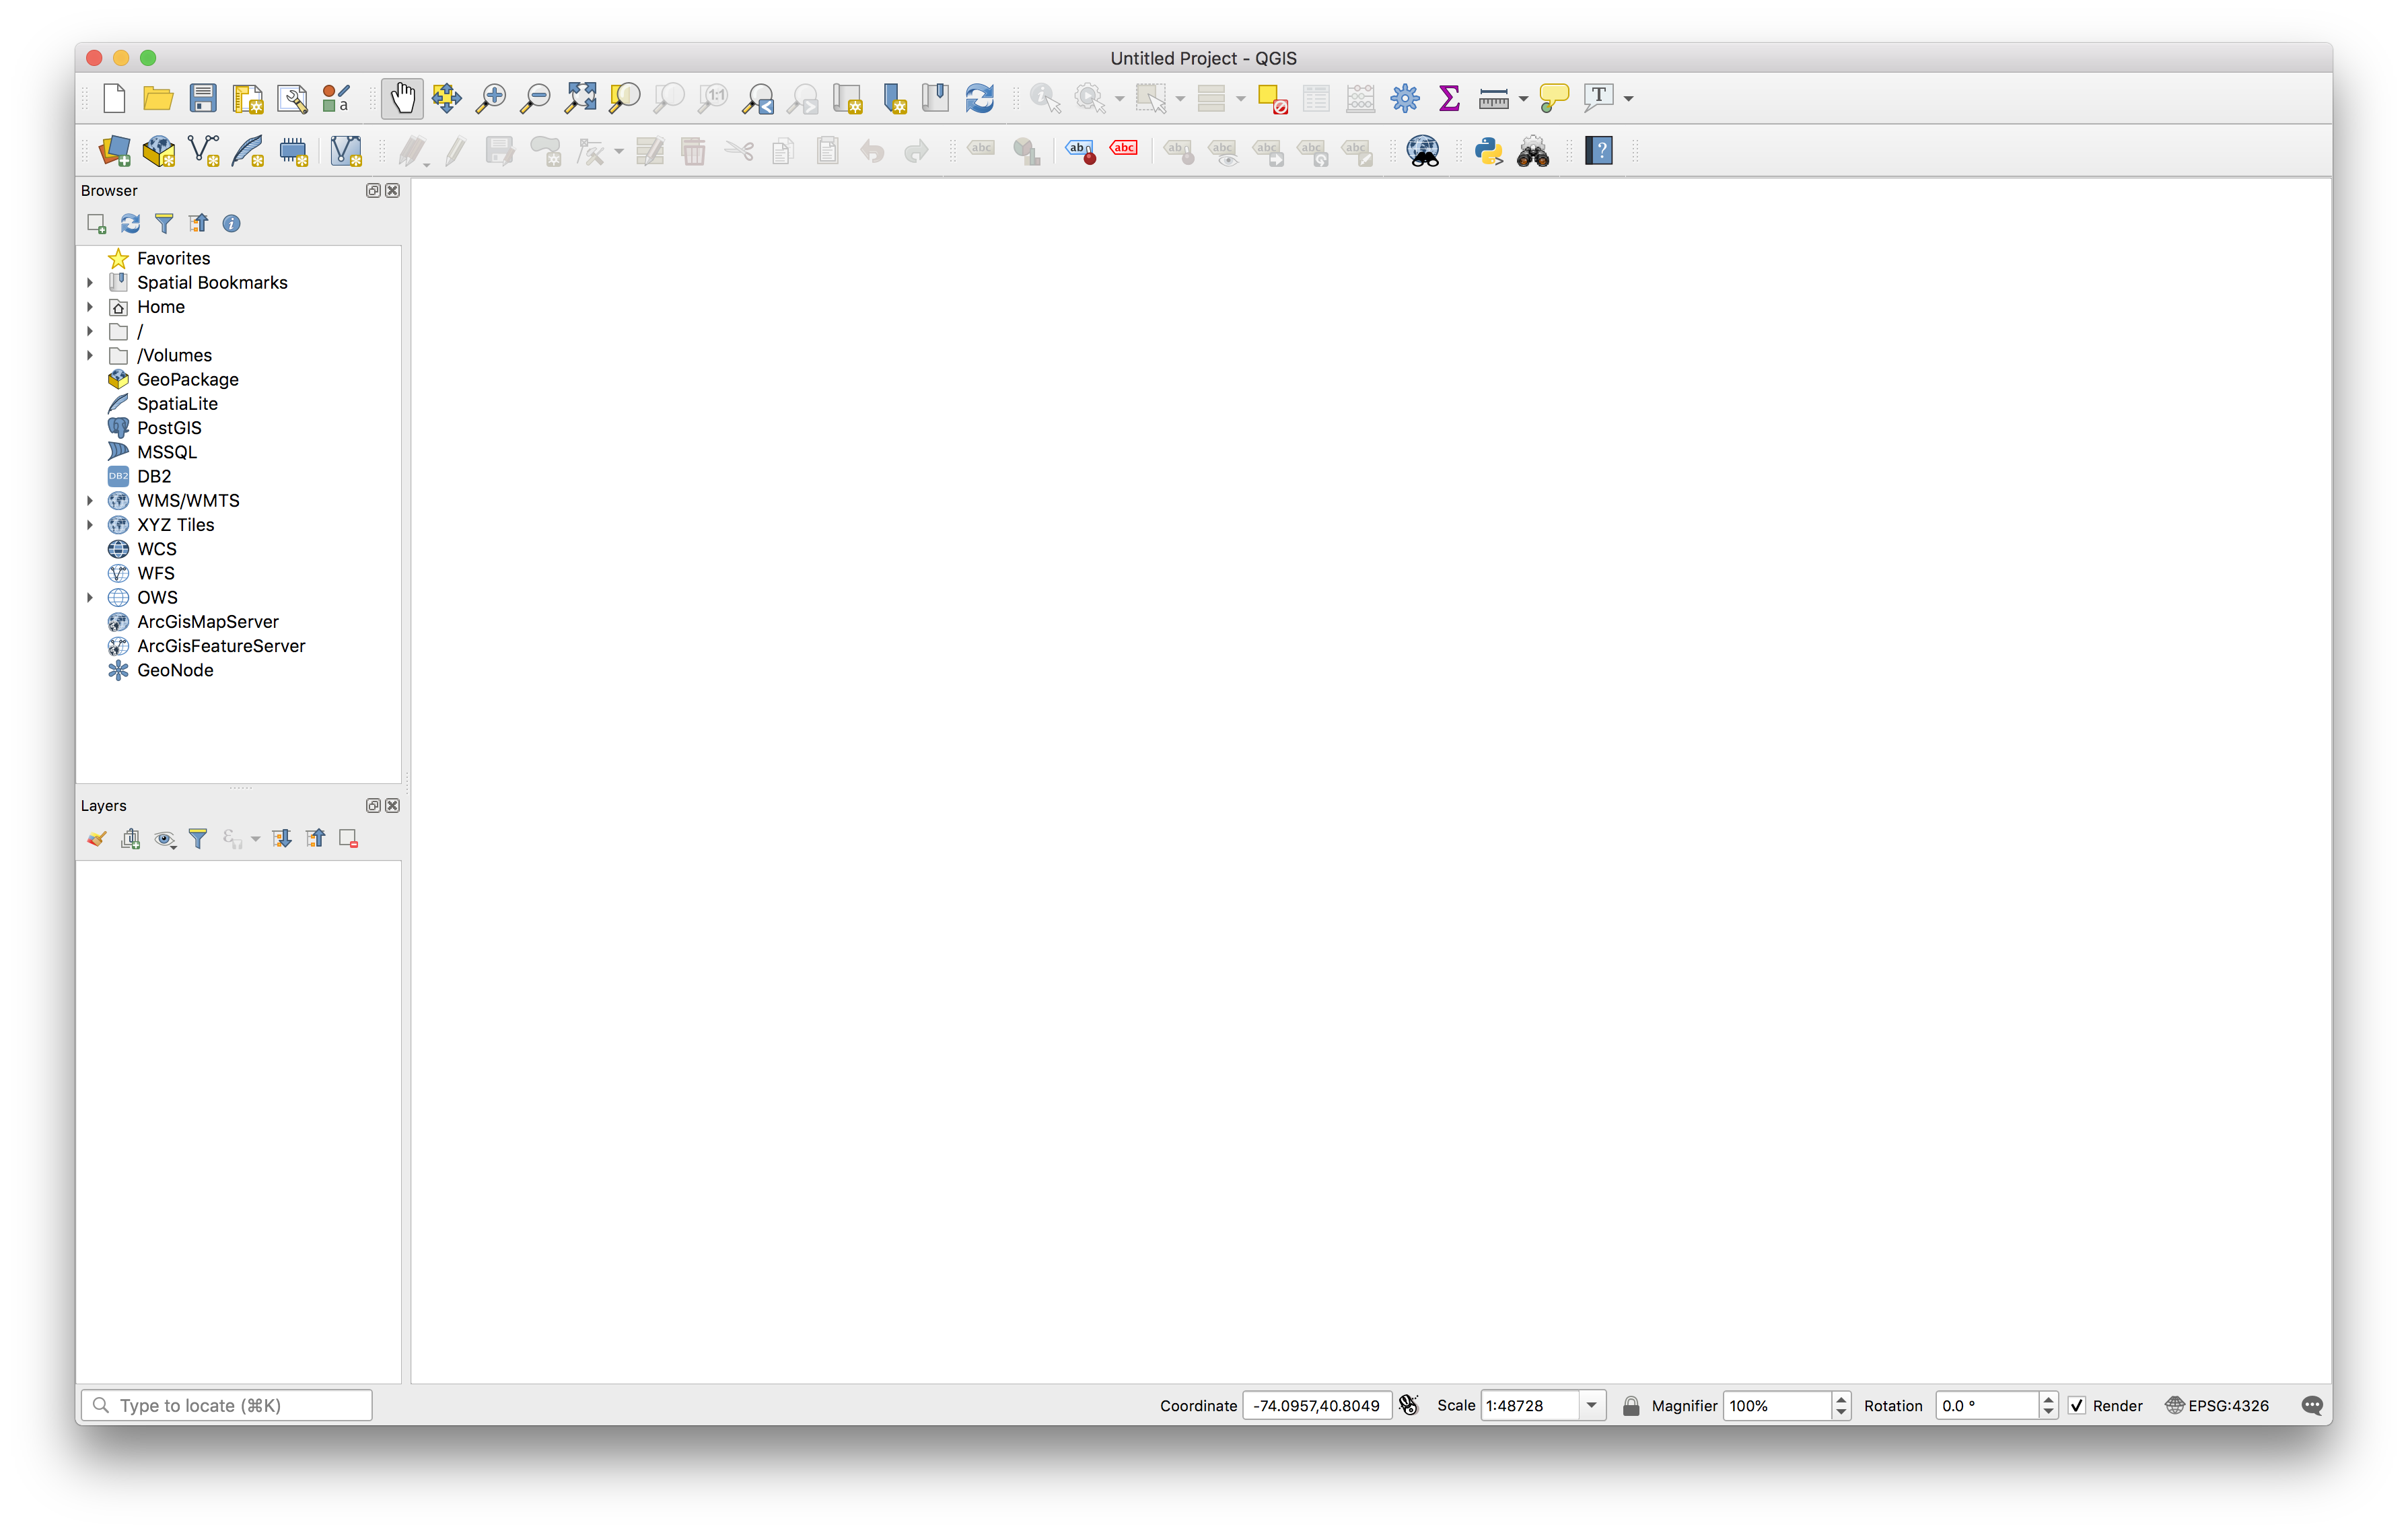
Open QGIS3.10 and create a new project
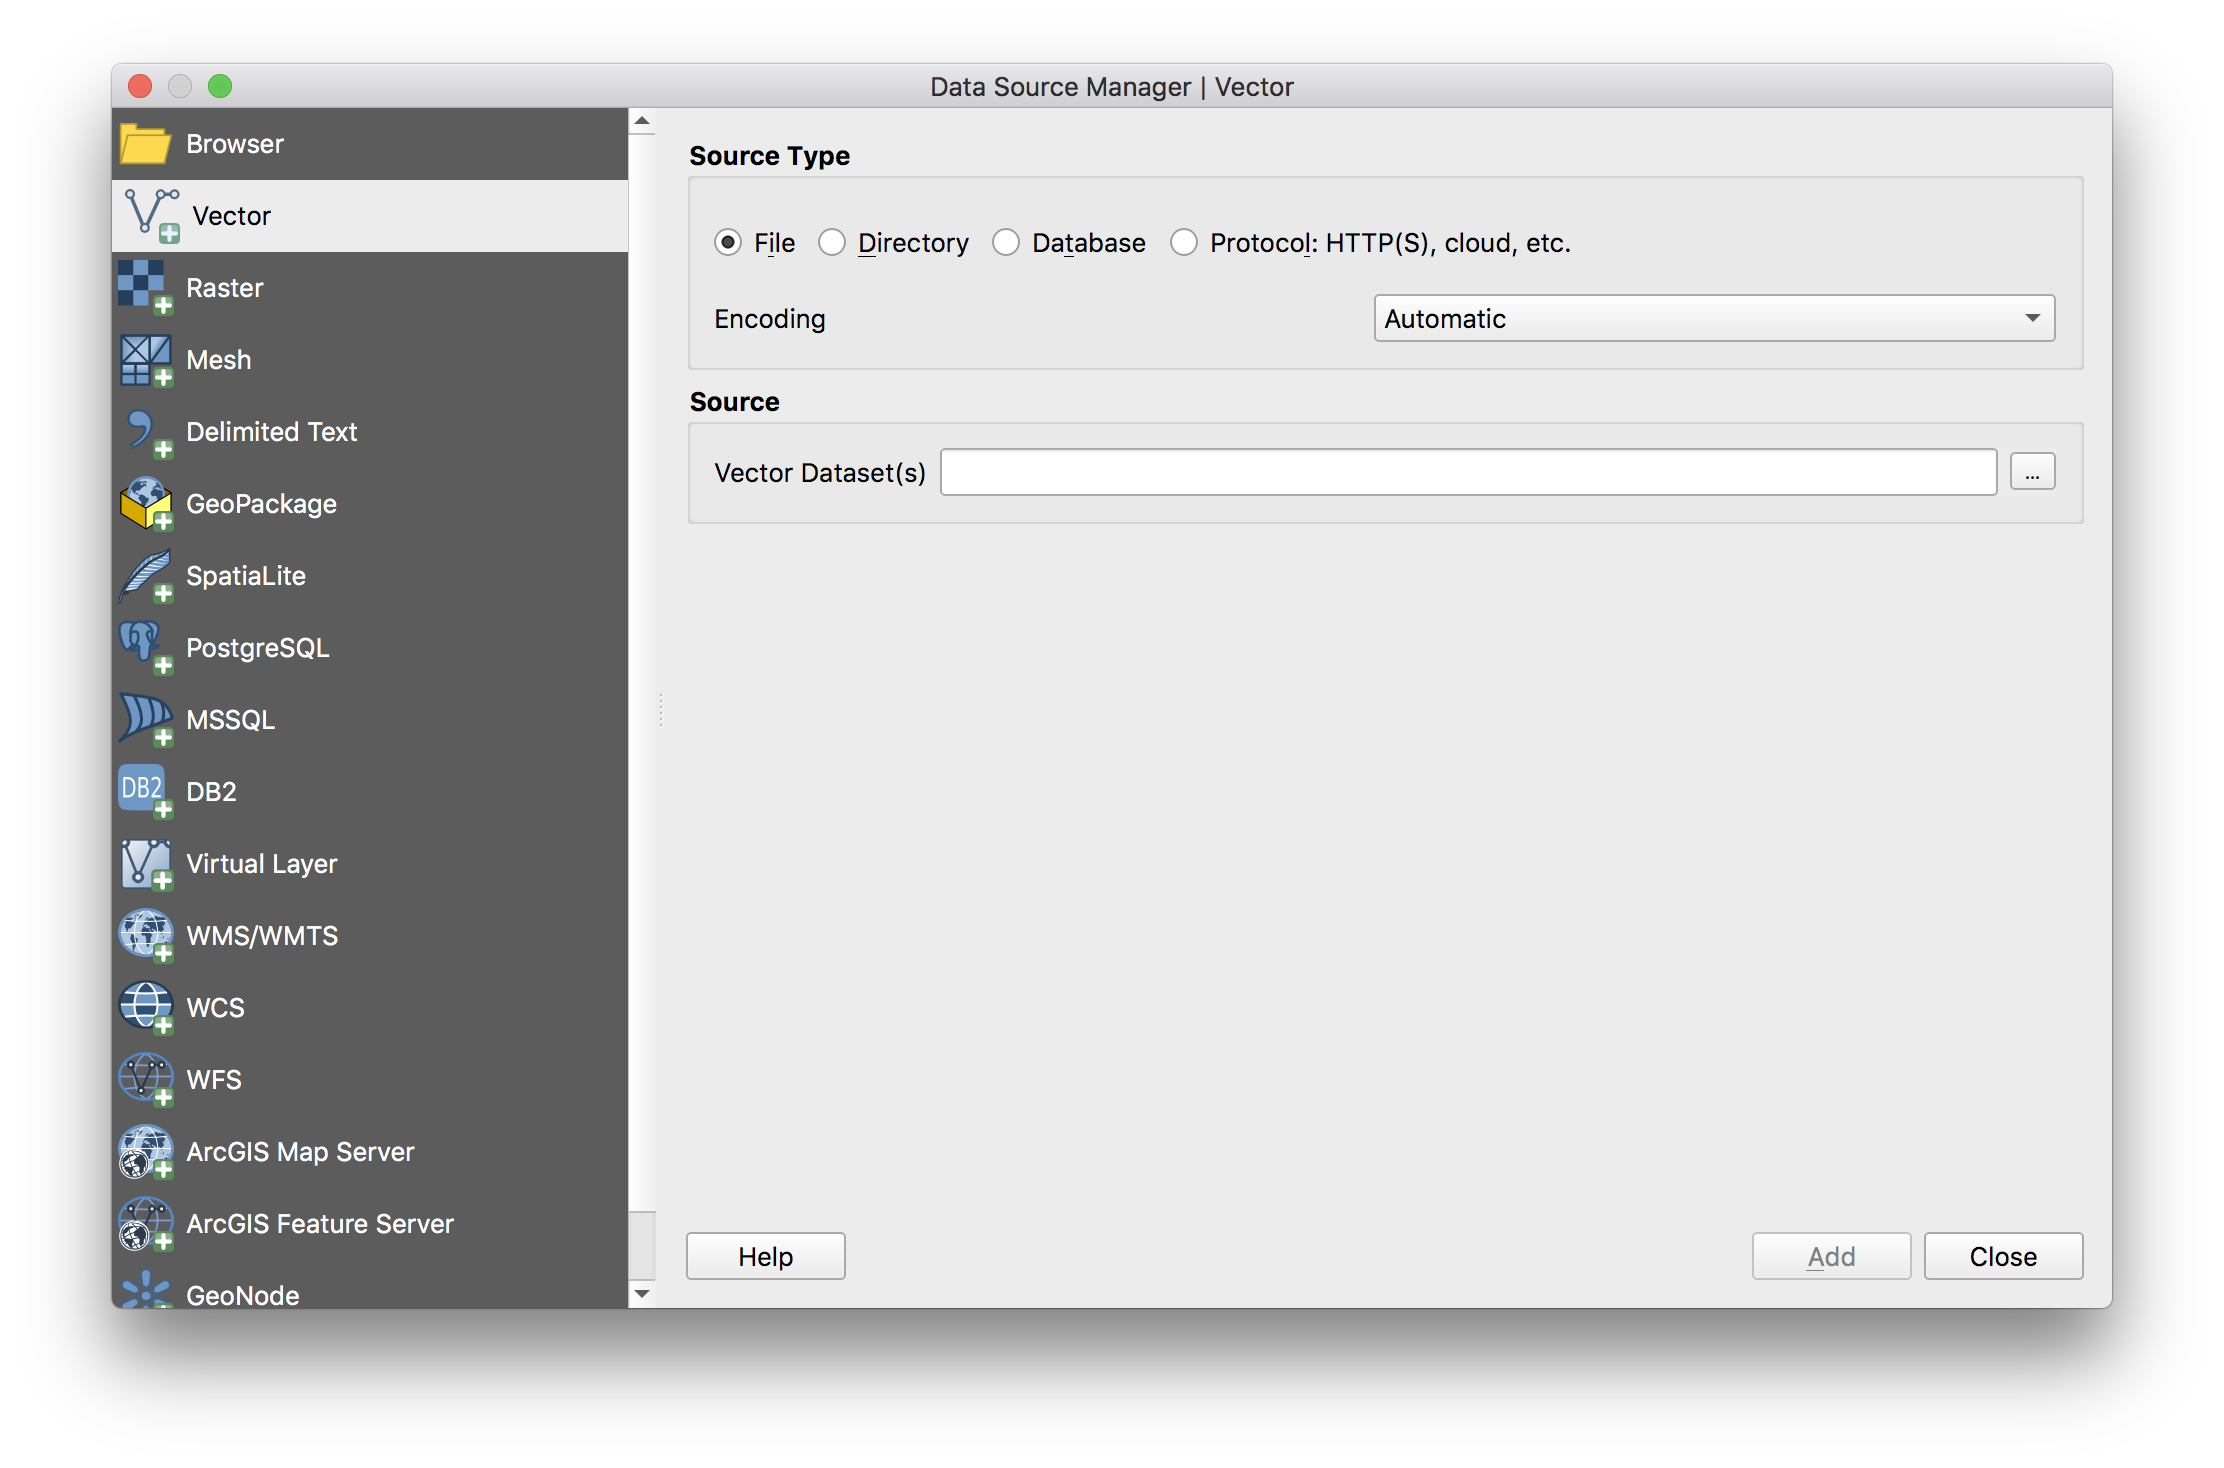
From the top menu bar select Layer and then Add Layer > Add Vector Layer.
When the Data Source Manager menu appears select the Source Type as File then click on the ... and navigate to the data folder for this assignment. Select the Tran_road_centerline_NJ.shp file. Take care to select the file with the .shp file extension. QGIS will do the work of interpreting the full shapefile and will pull the projection and database information from the other files in the roads folder.
You may receive a dialog box prompting you to select a datum transformation. Choose the Preferred option and select Okay.
SAVE your project. Save the project inside the 01_mapping-where-things-are folder. Title the project mapping-things.qgz.
Follow the same process as above to add the remaining datasets within the data folder for this assignment. Add all of the data sets except for the .csv file in the newark_vacant folder.
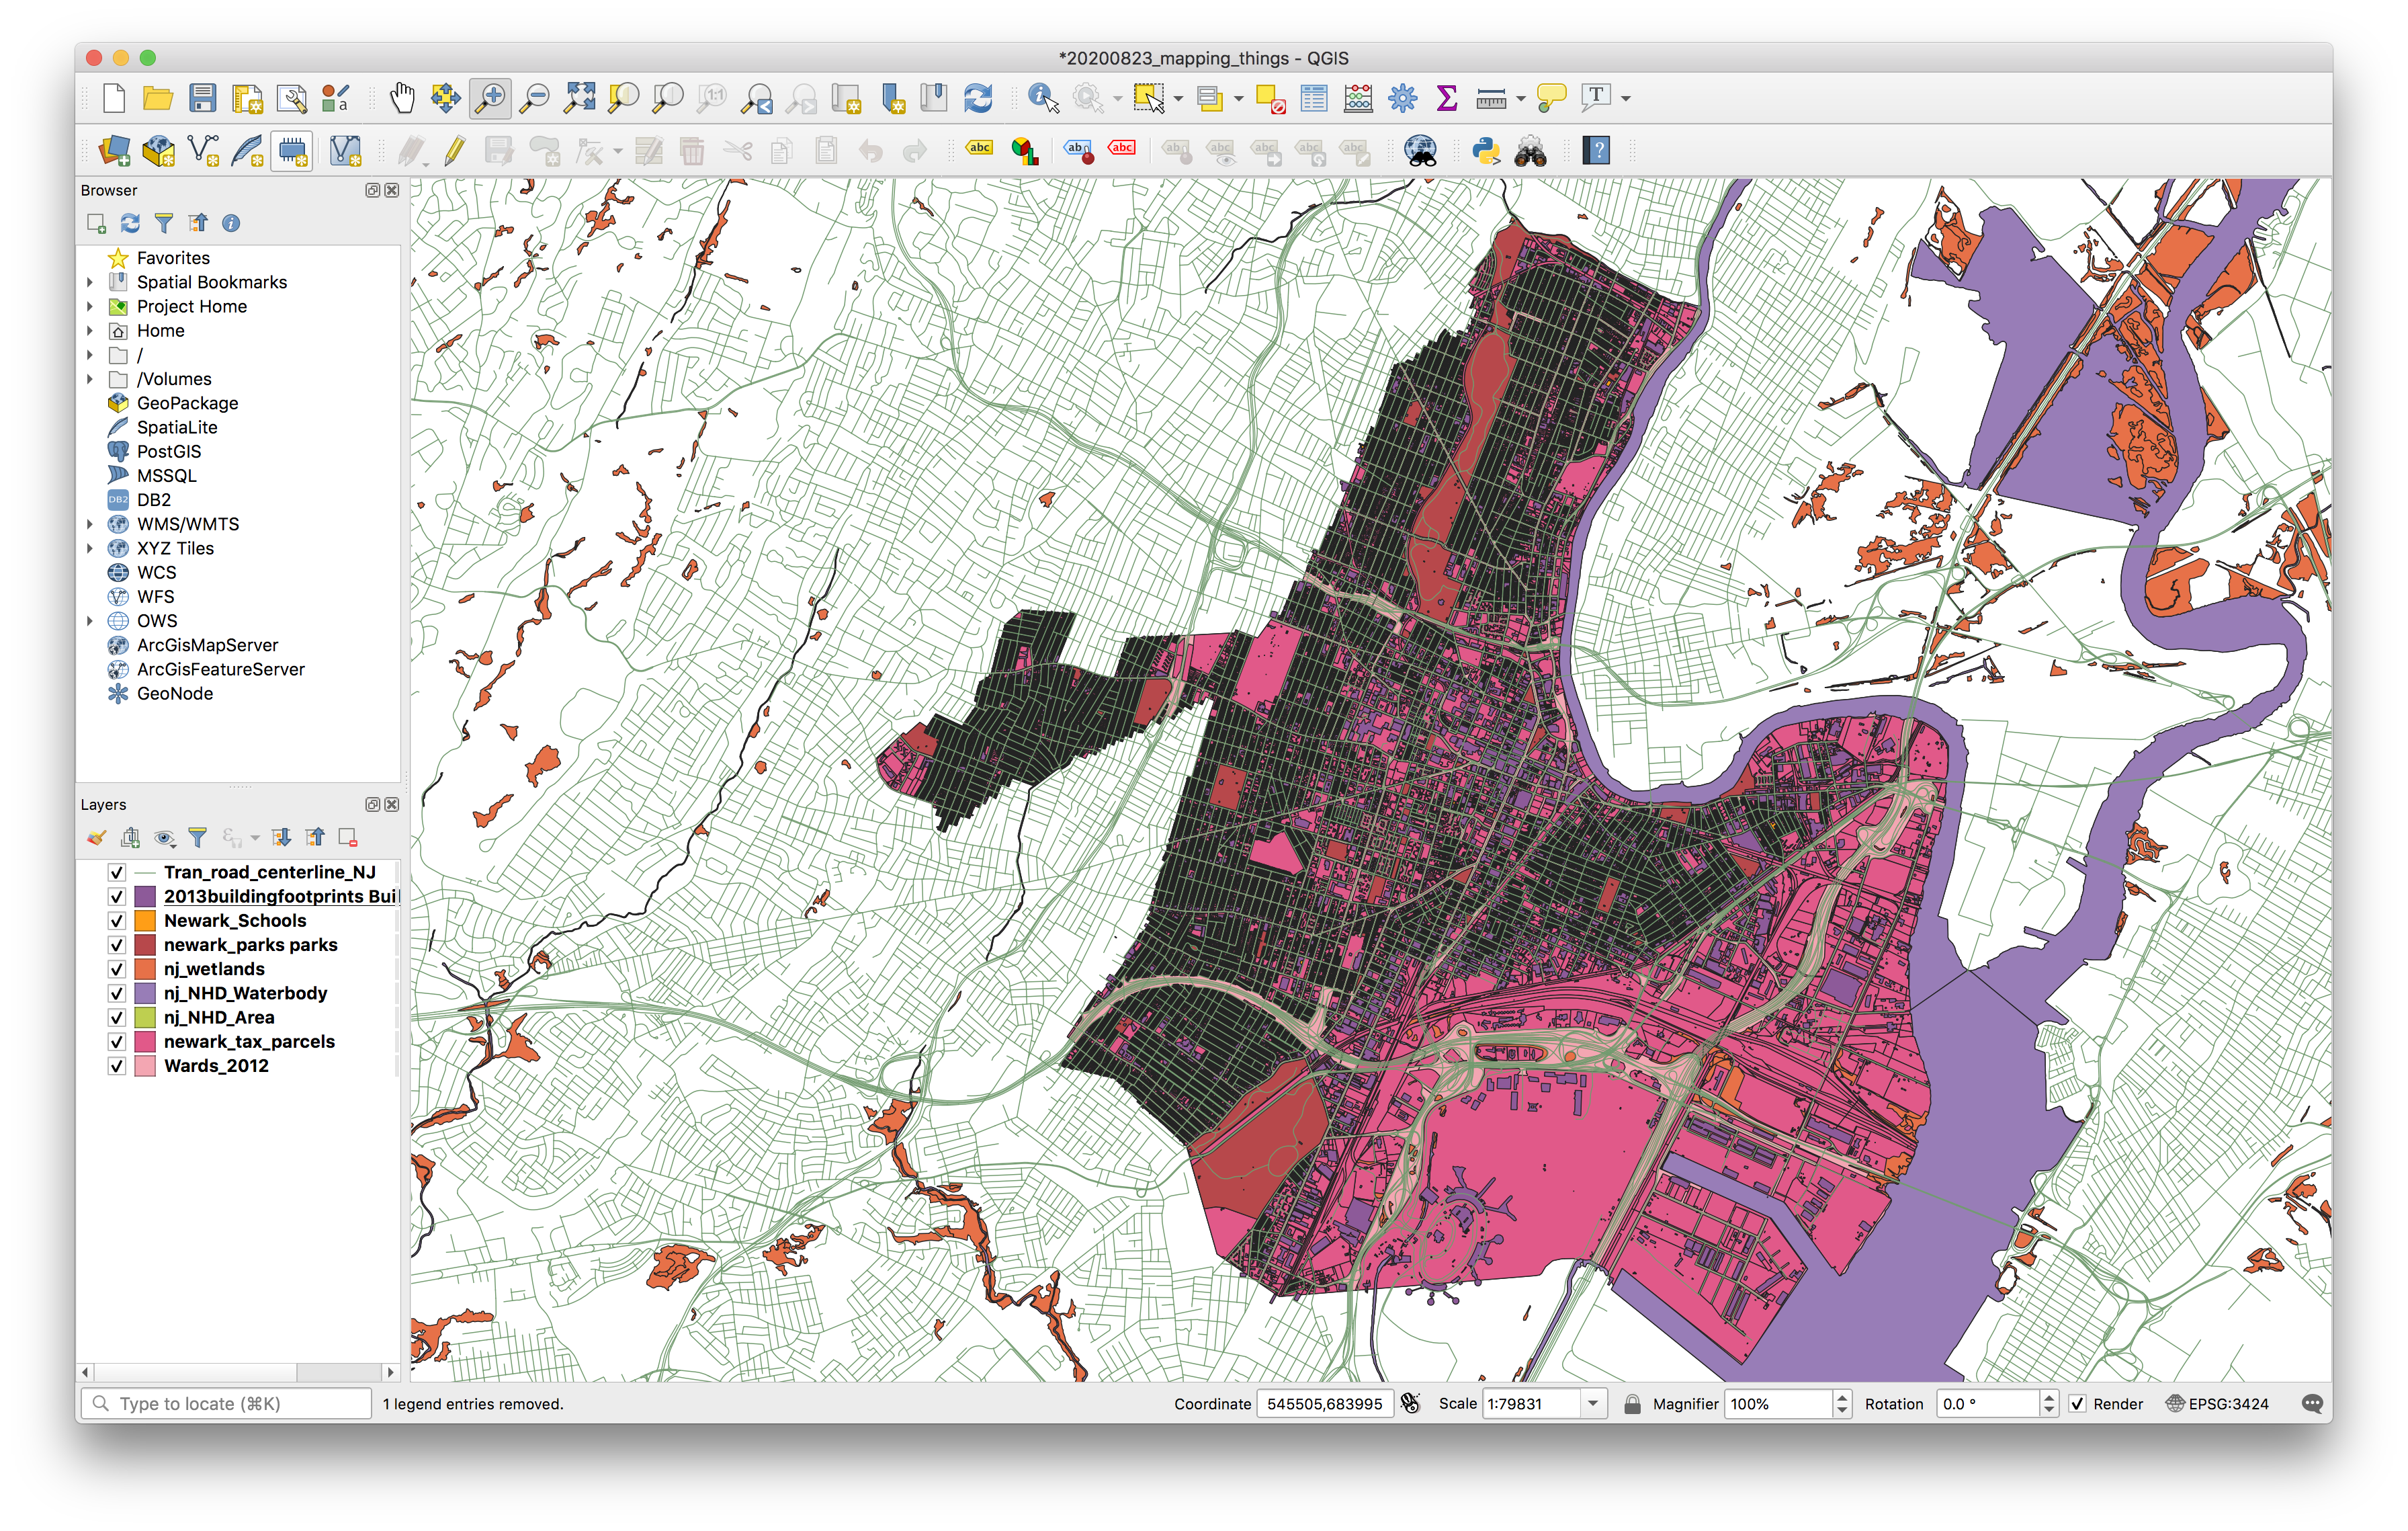
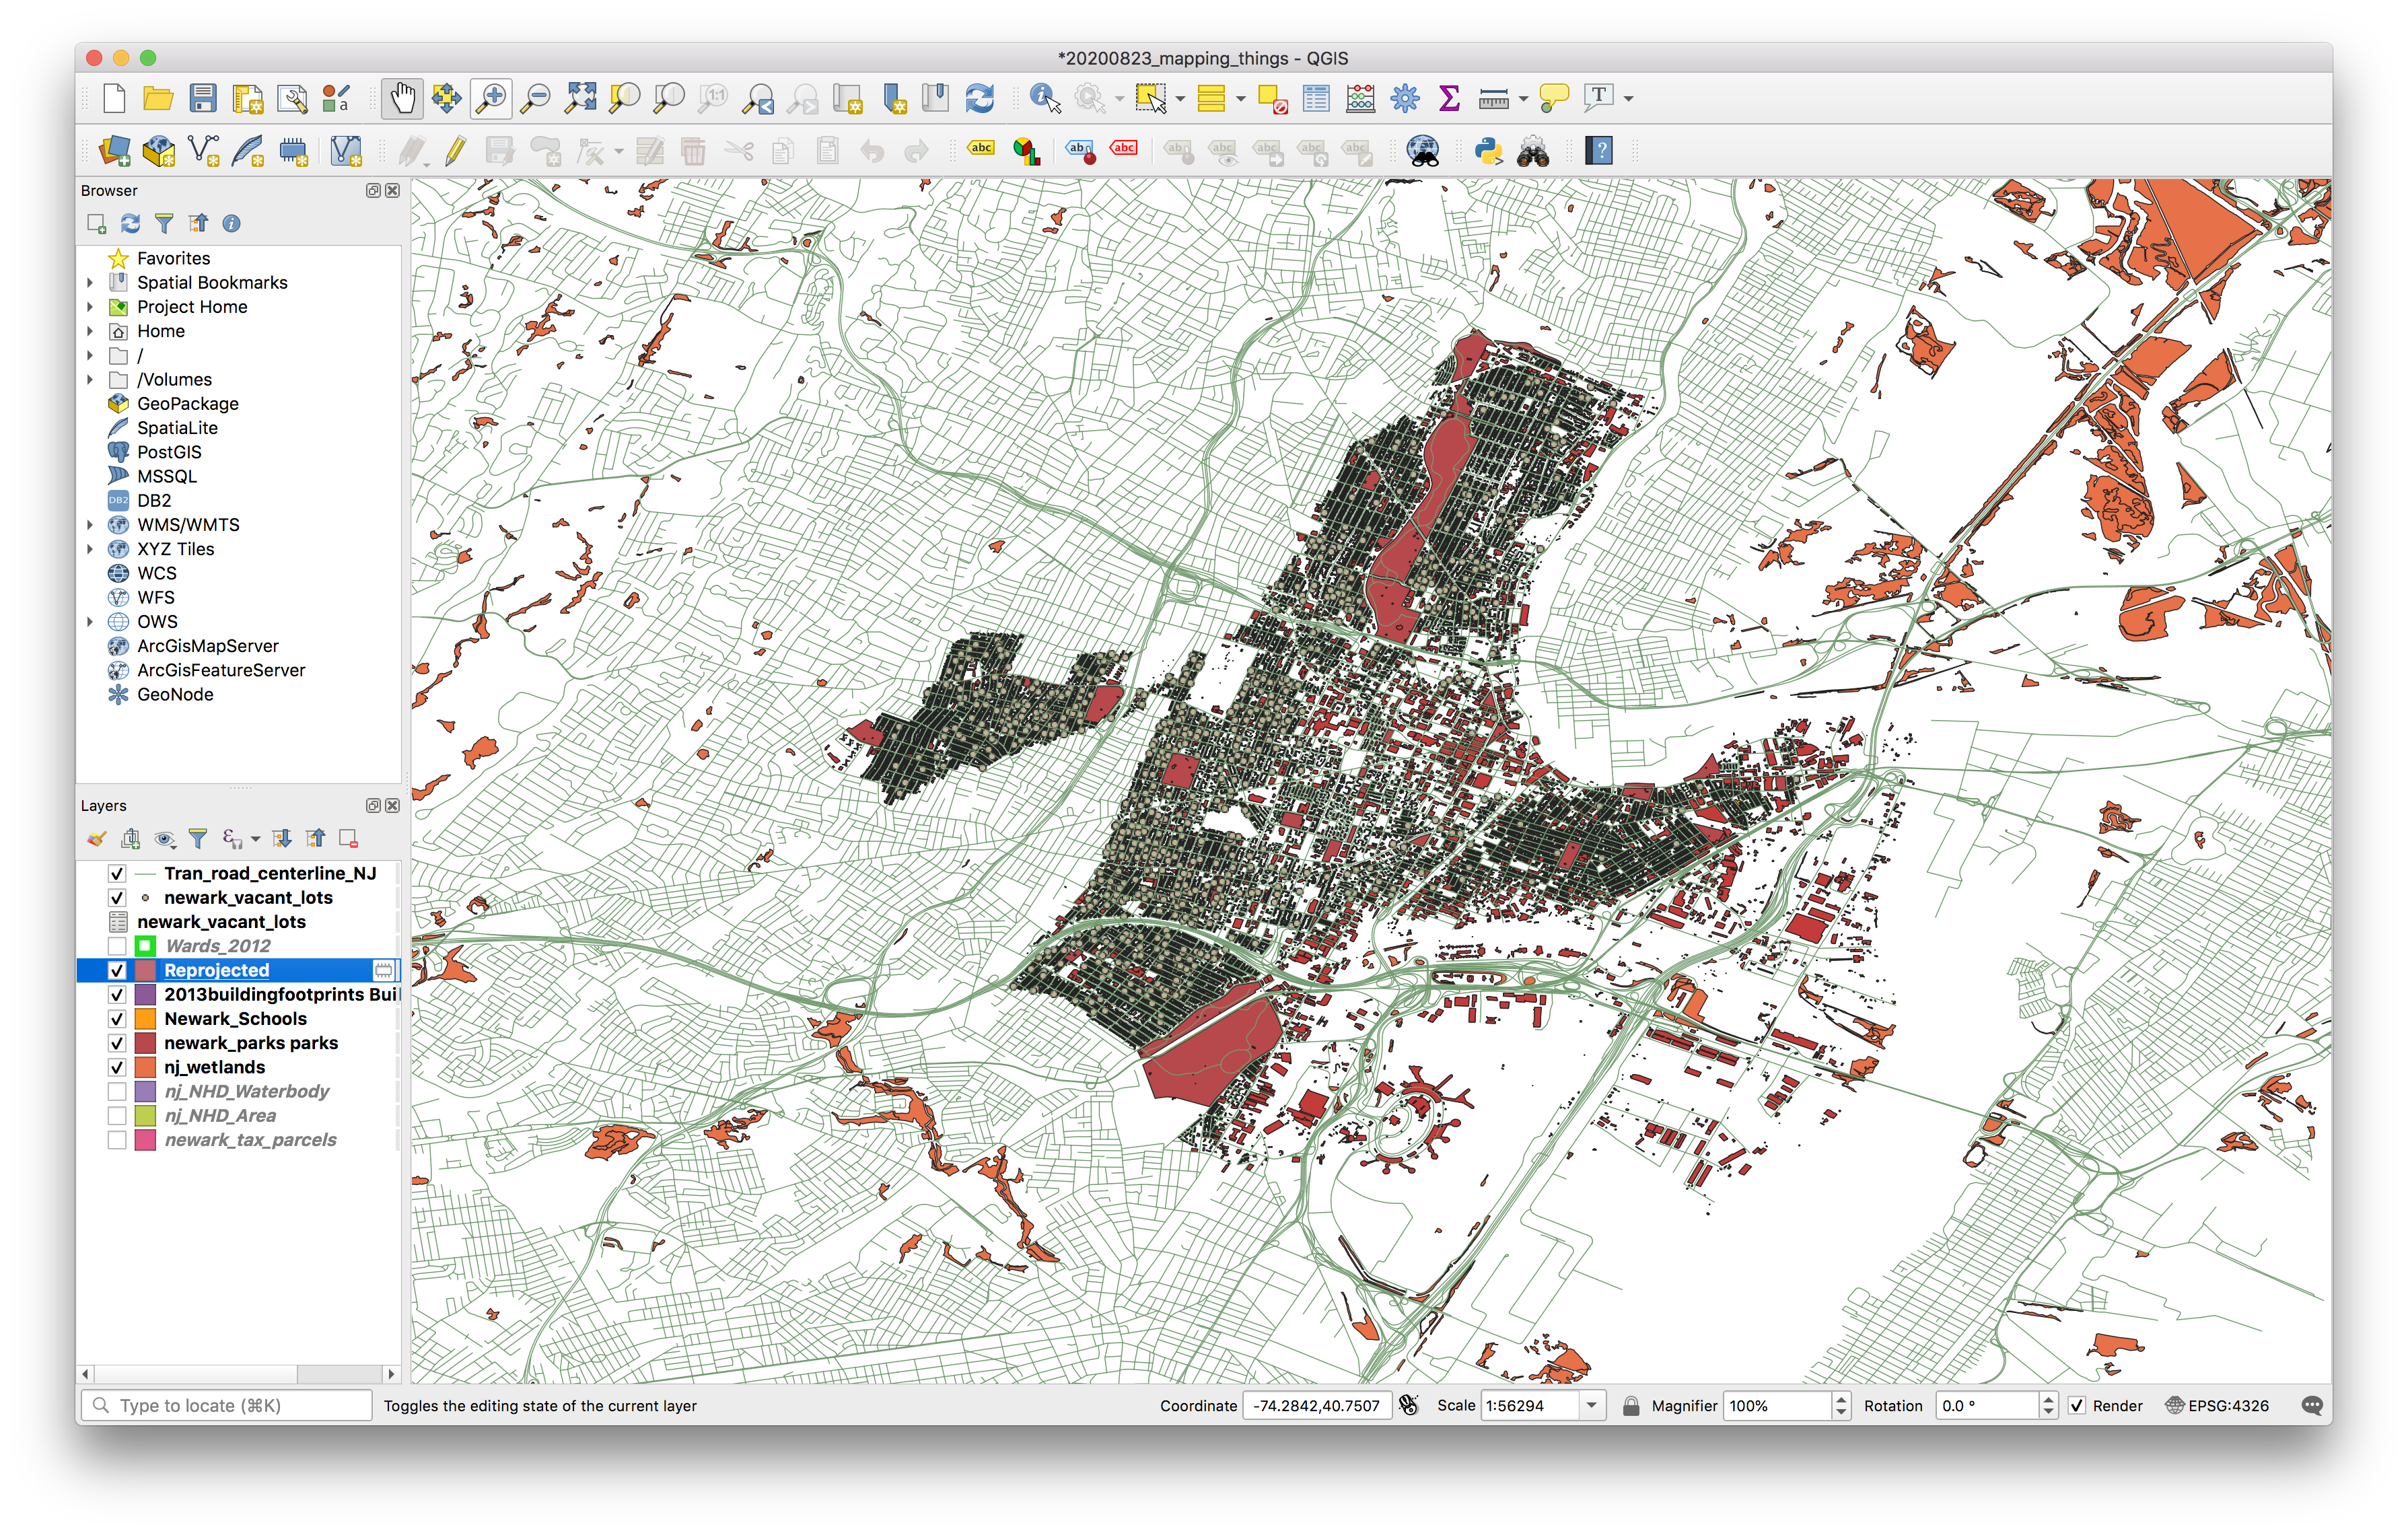
The layers added will each be assigned a random color – that will be different from the colors in the screenshot below.
SAVE your project.
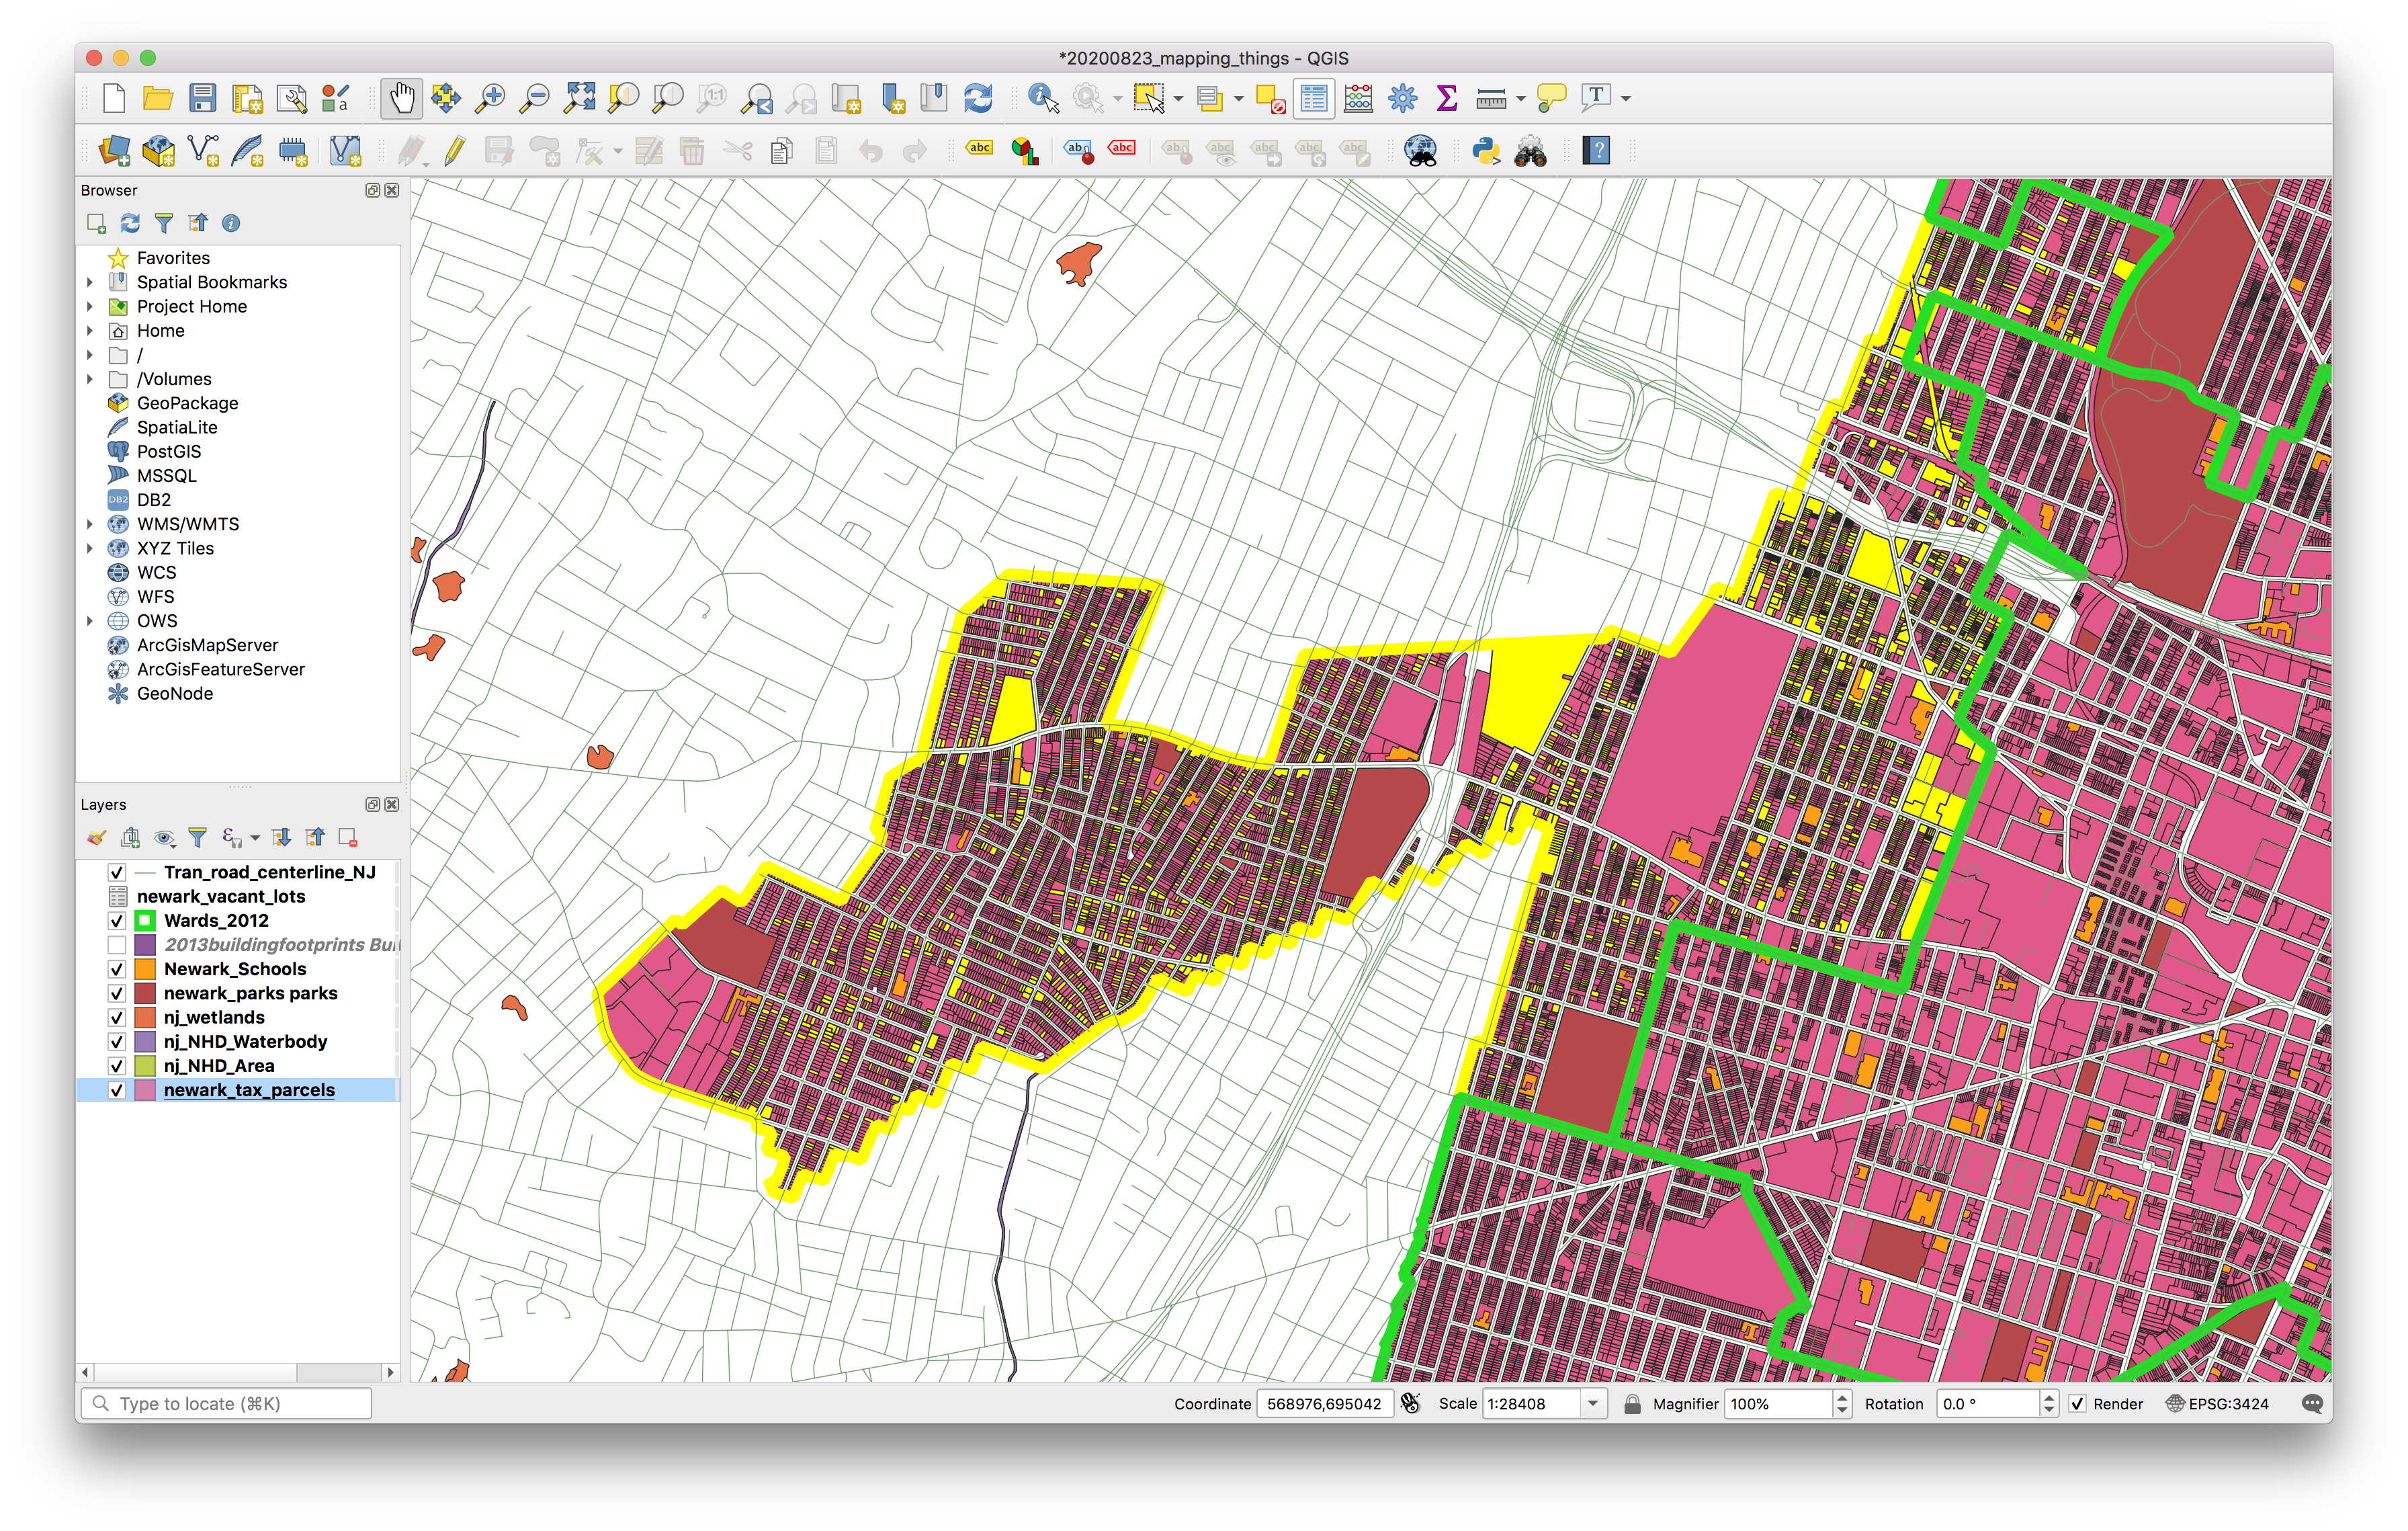
Use the zoom and pan buttons in the tool bar to navigate to a location of interest in Newark.
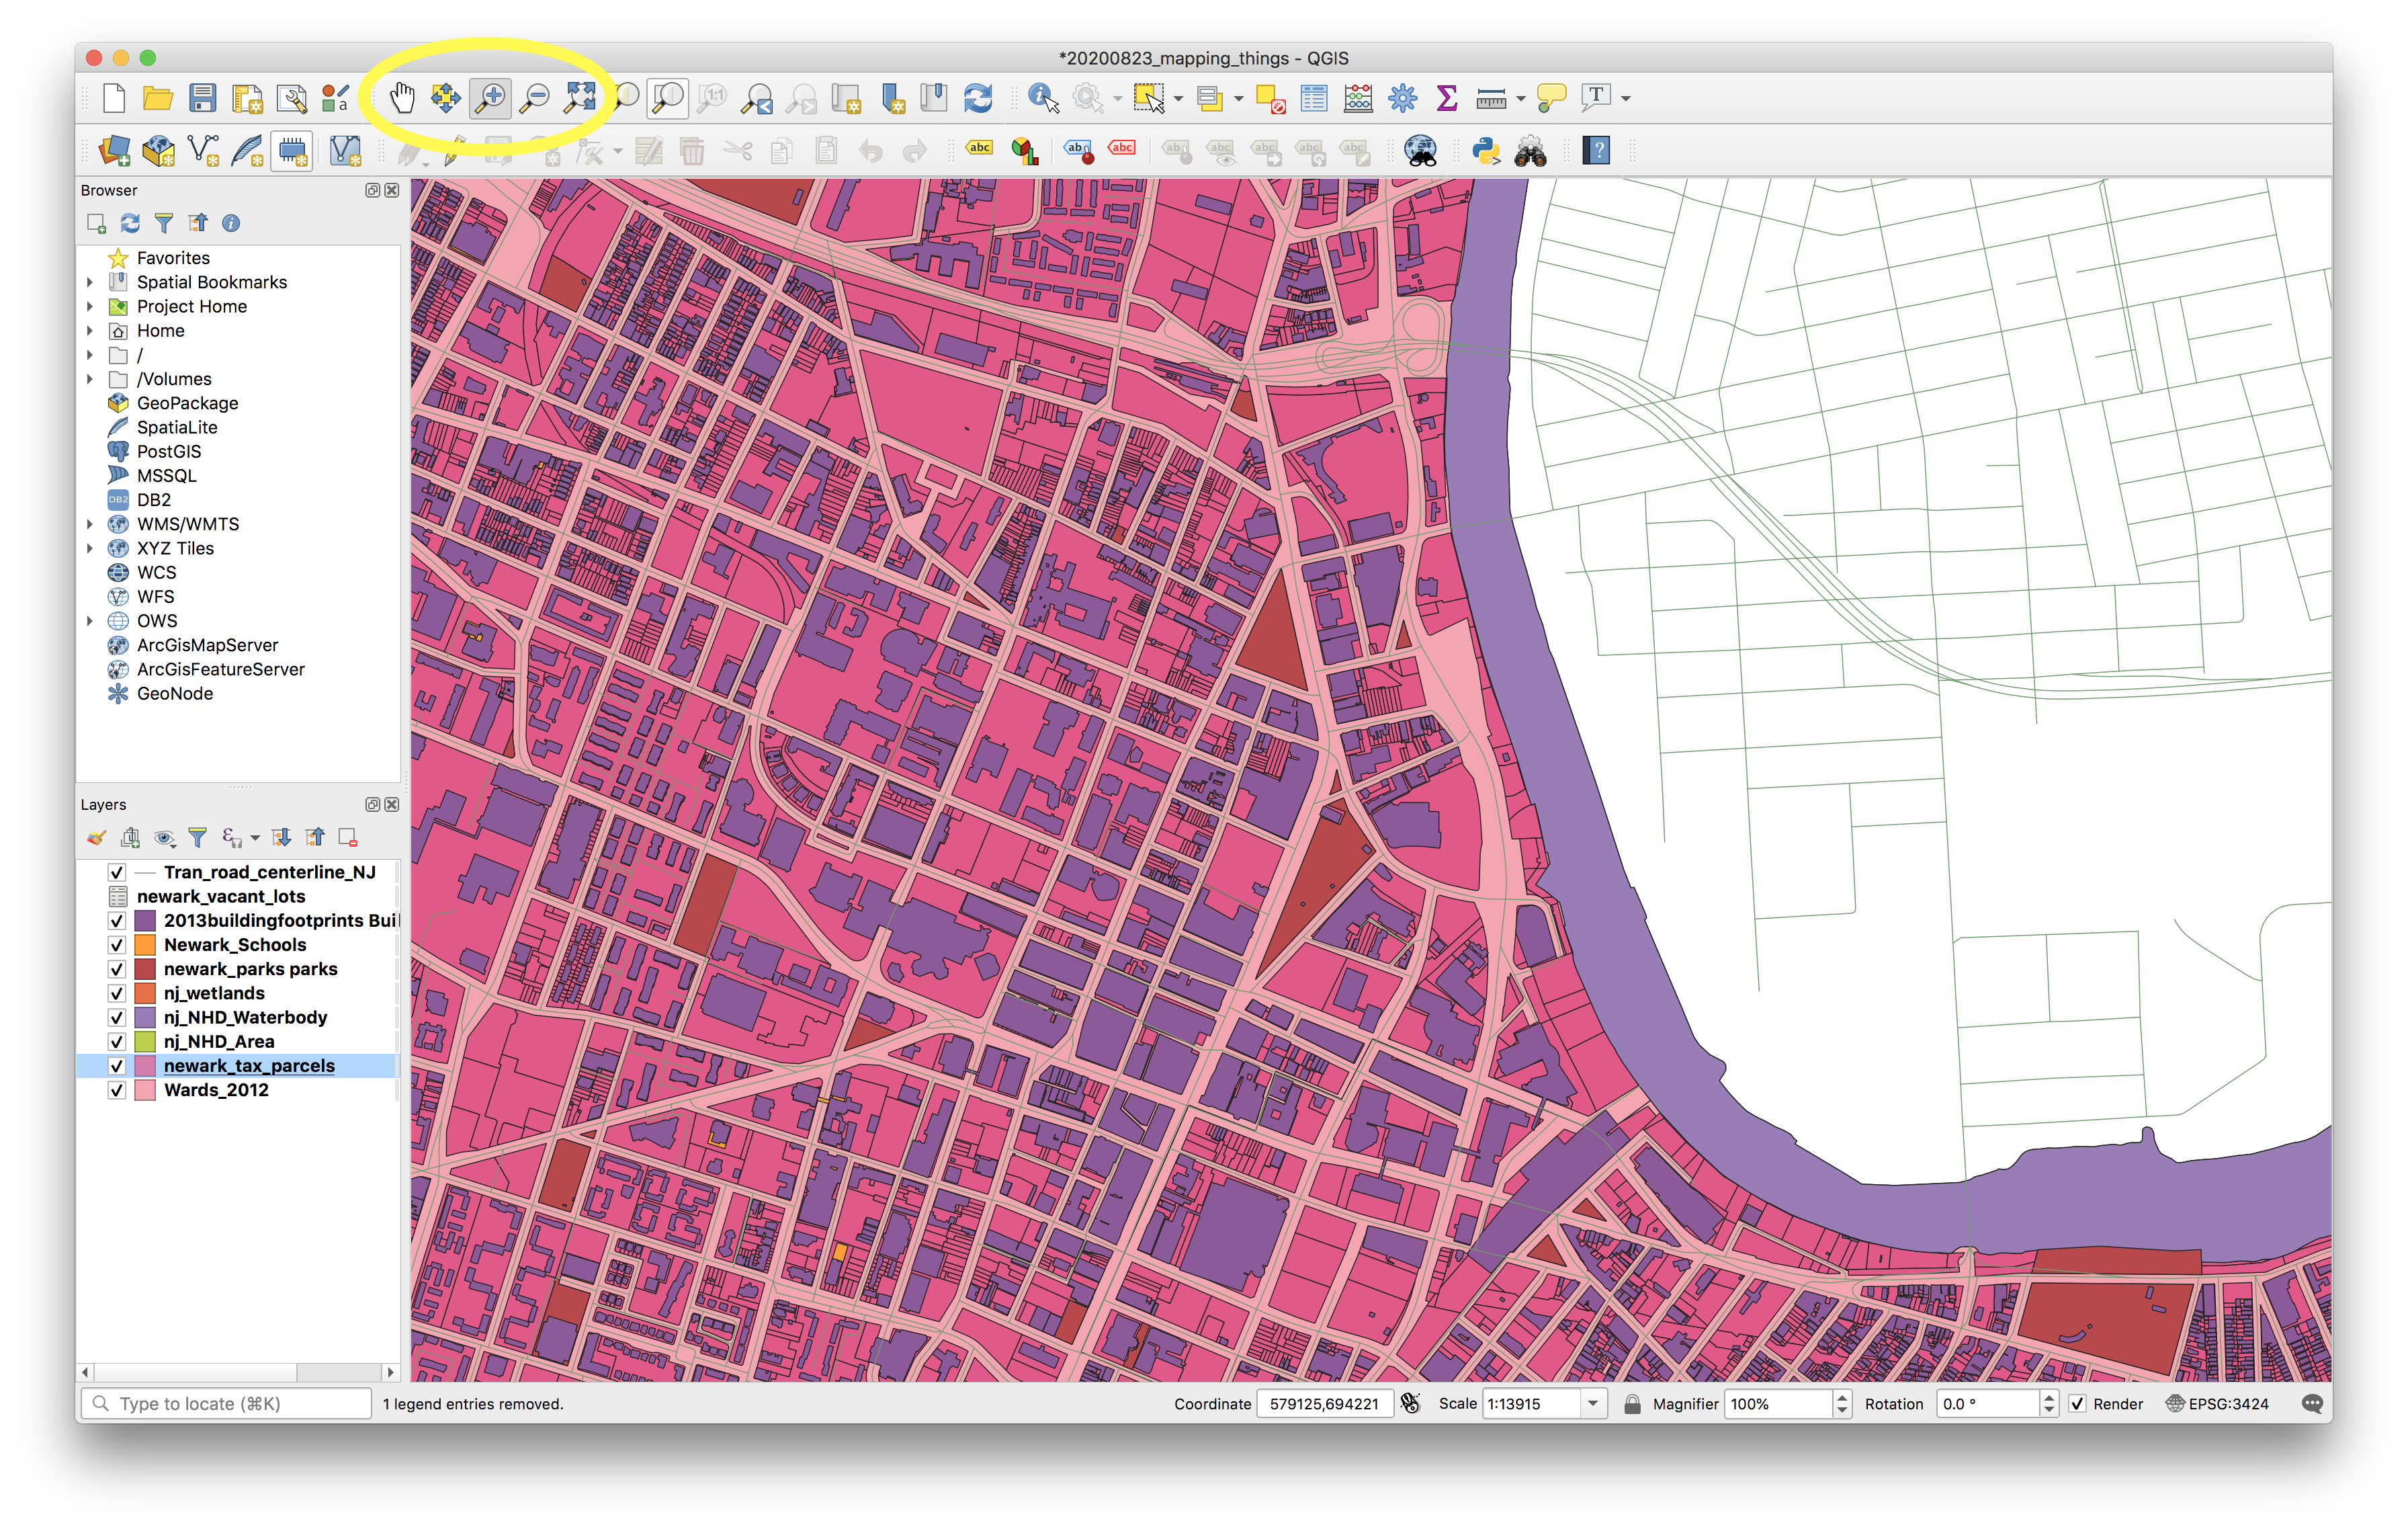
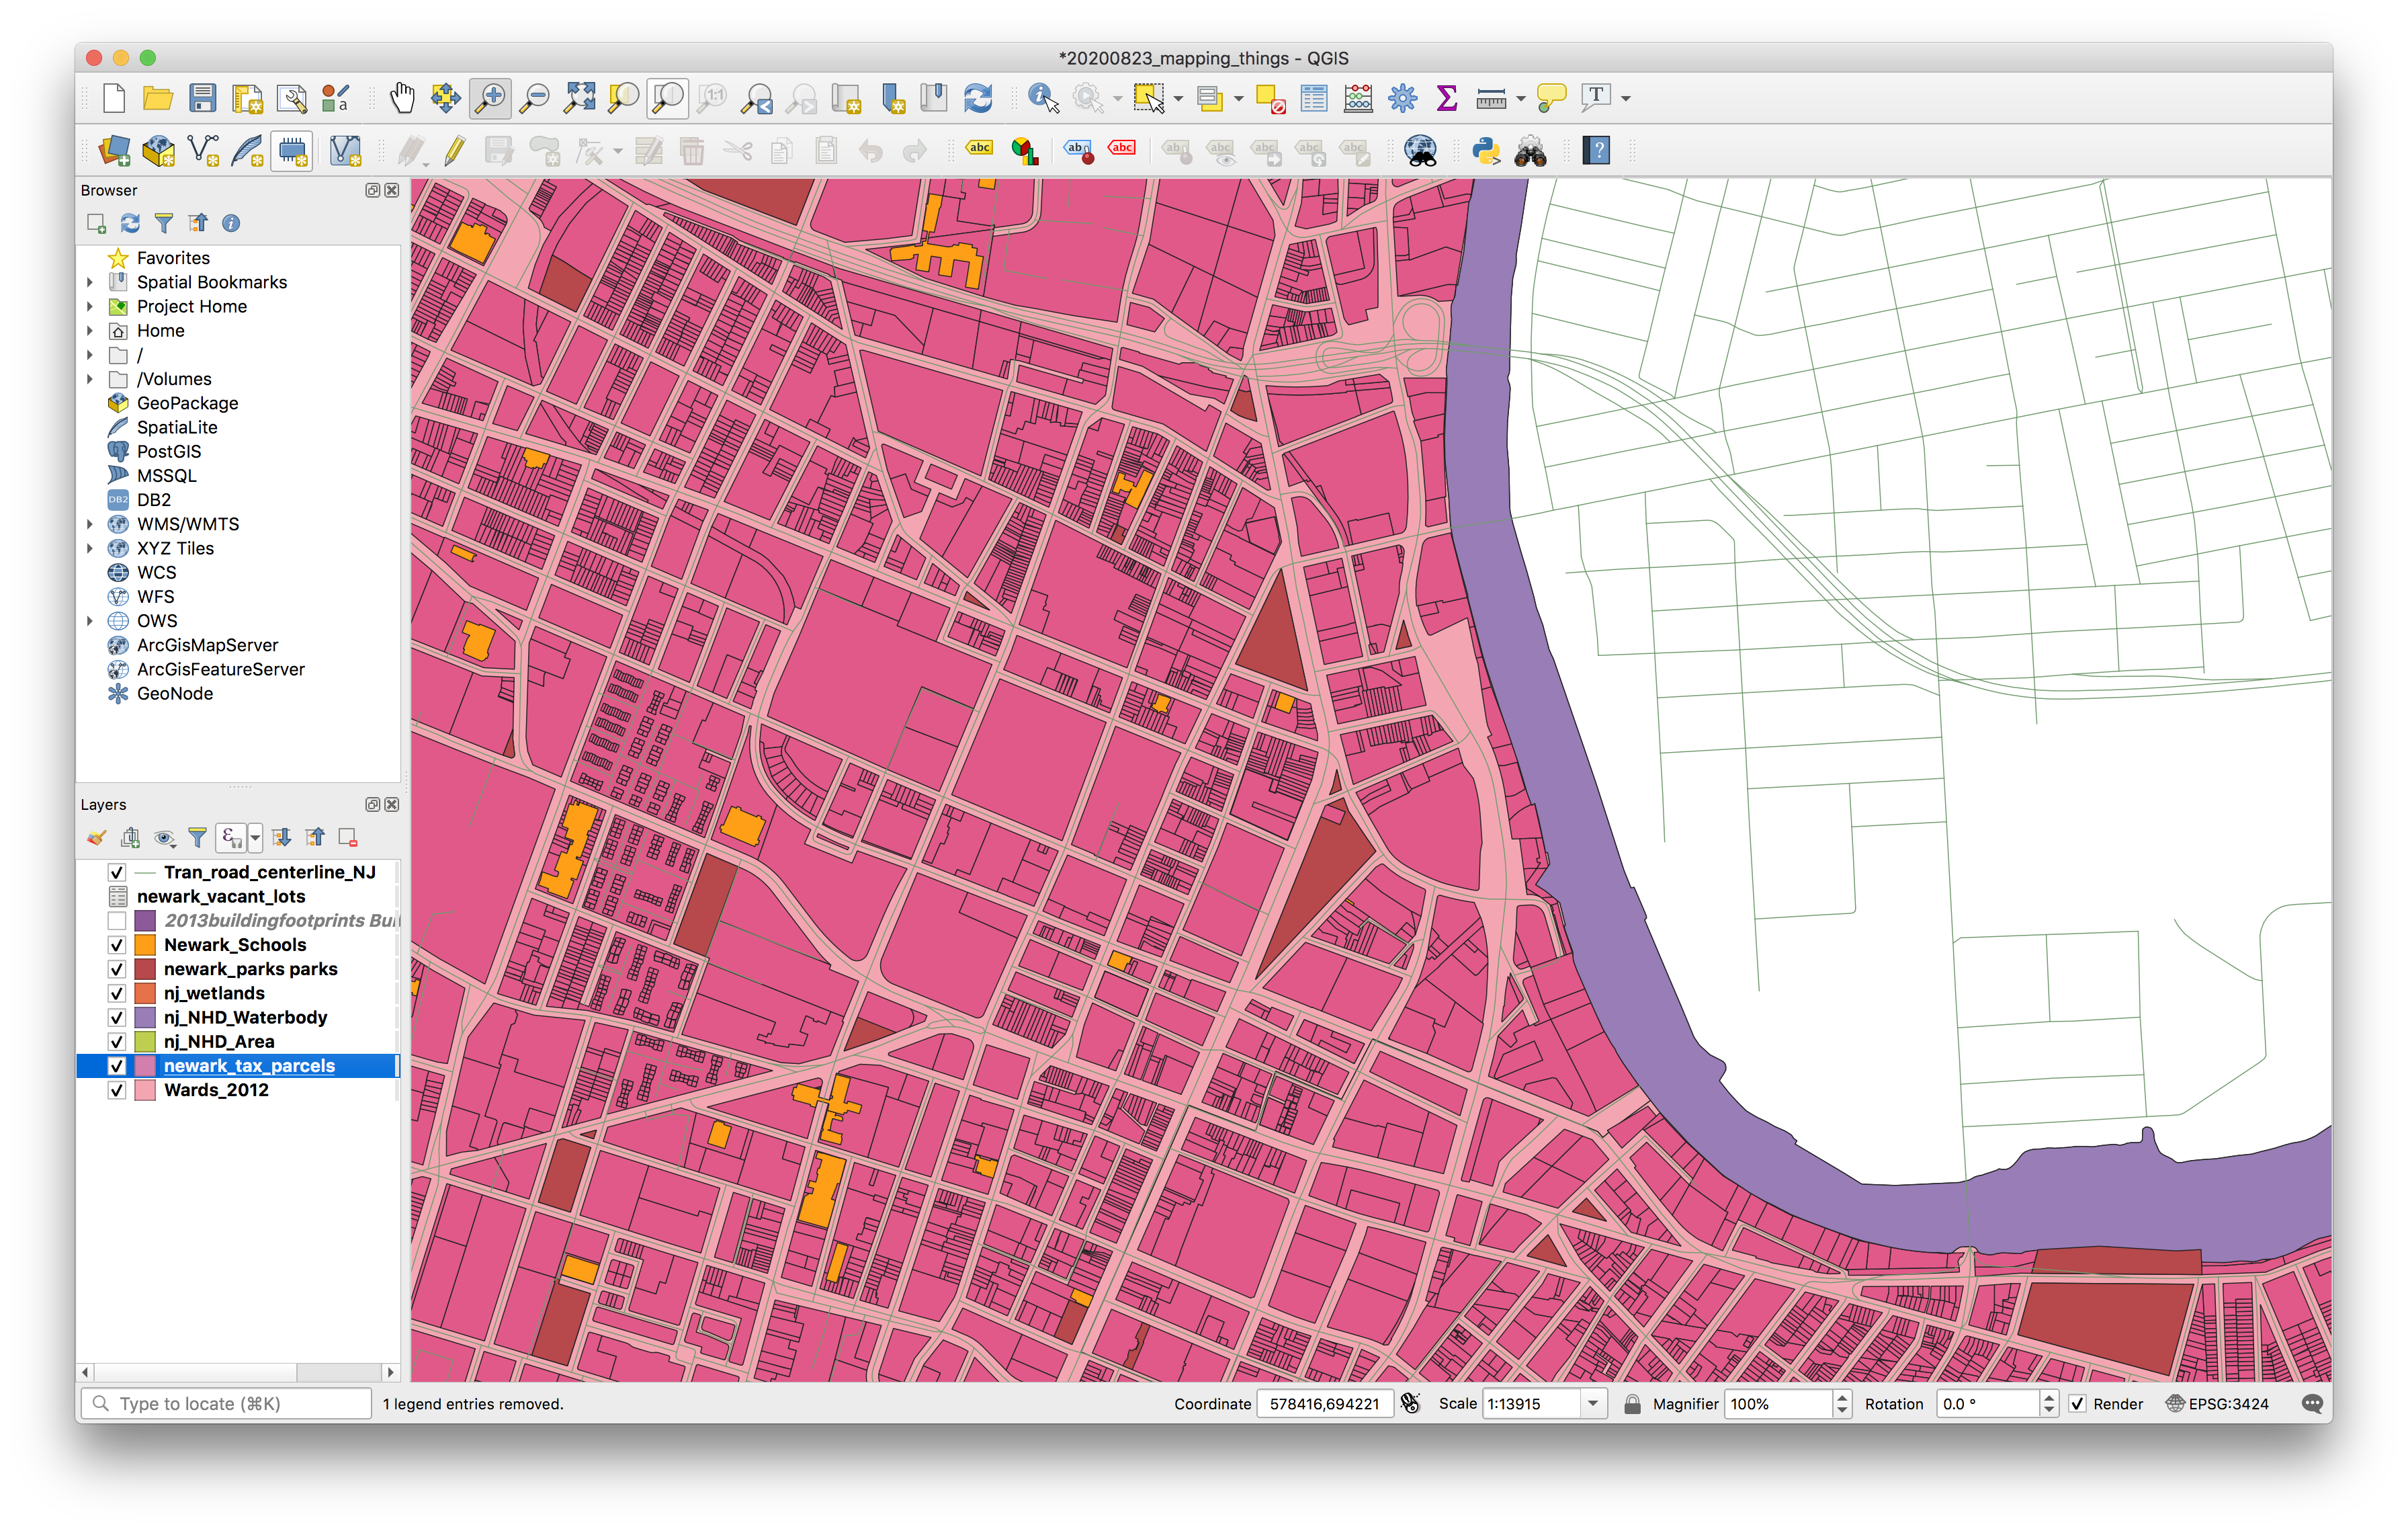
Adjust the layer order and visibility so that you can see the tax parcels layer. The check box next to each layer determines whether or not it is visible in the map canvas. The order of the layers in the Layers panel determines the order of the layers in the map canvas.
Basic data queries: who owns Newark?
How many tax parcels list an owner address from outside of Newark? We’ll use the newark_tax_parcels dataset to find out.
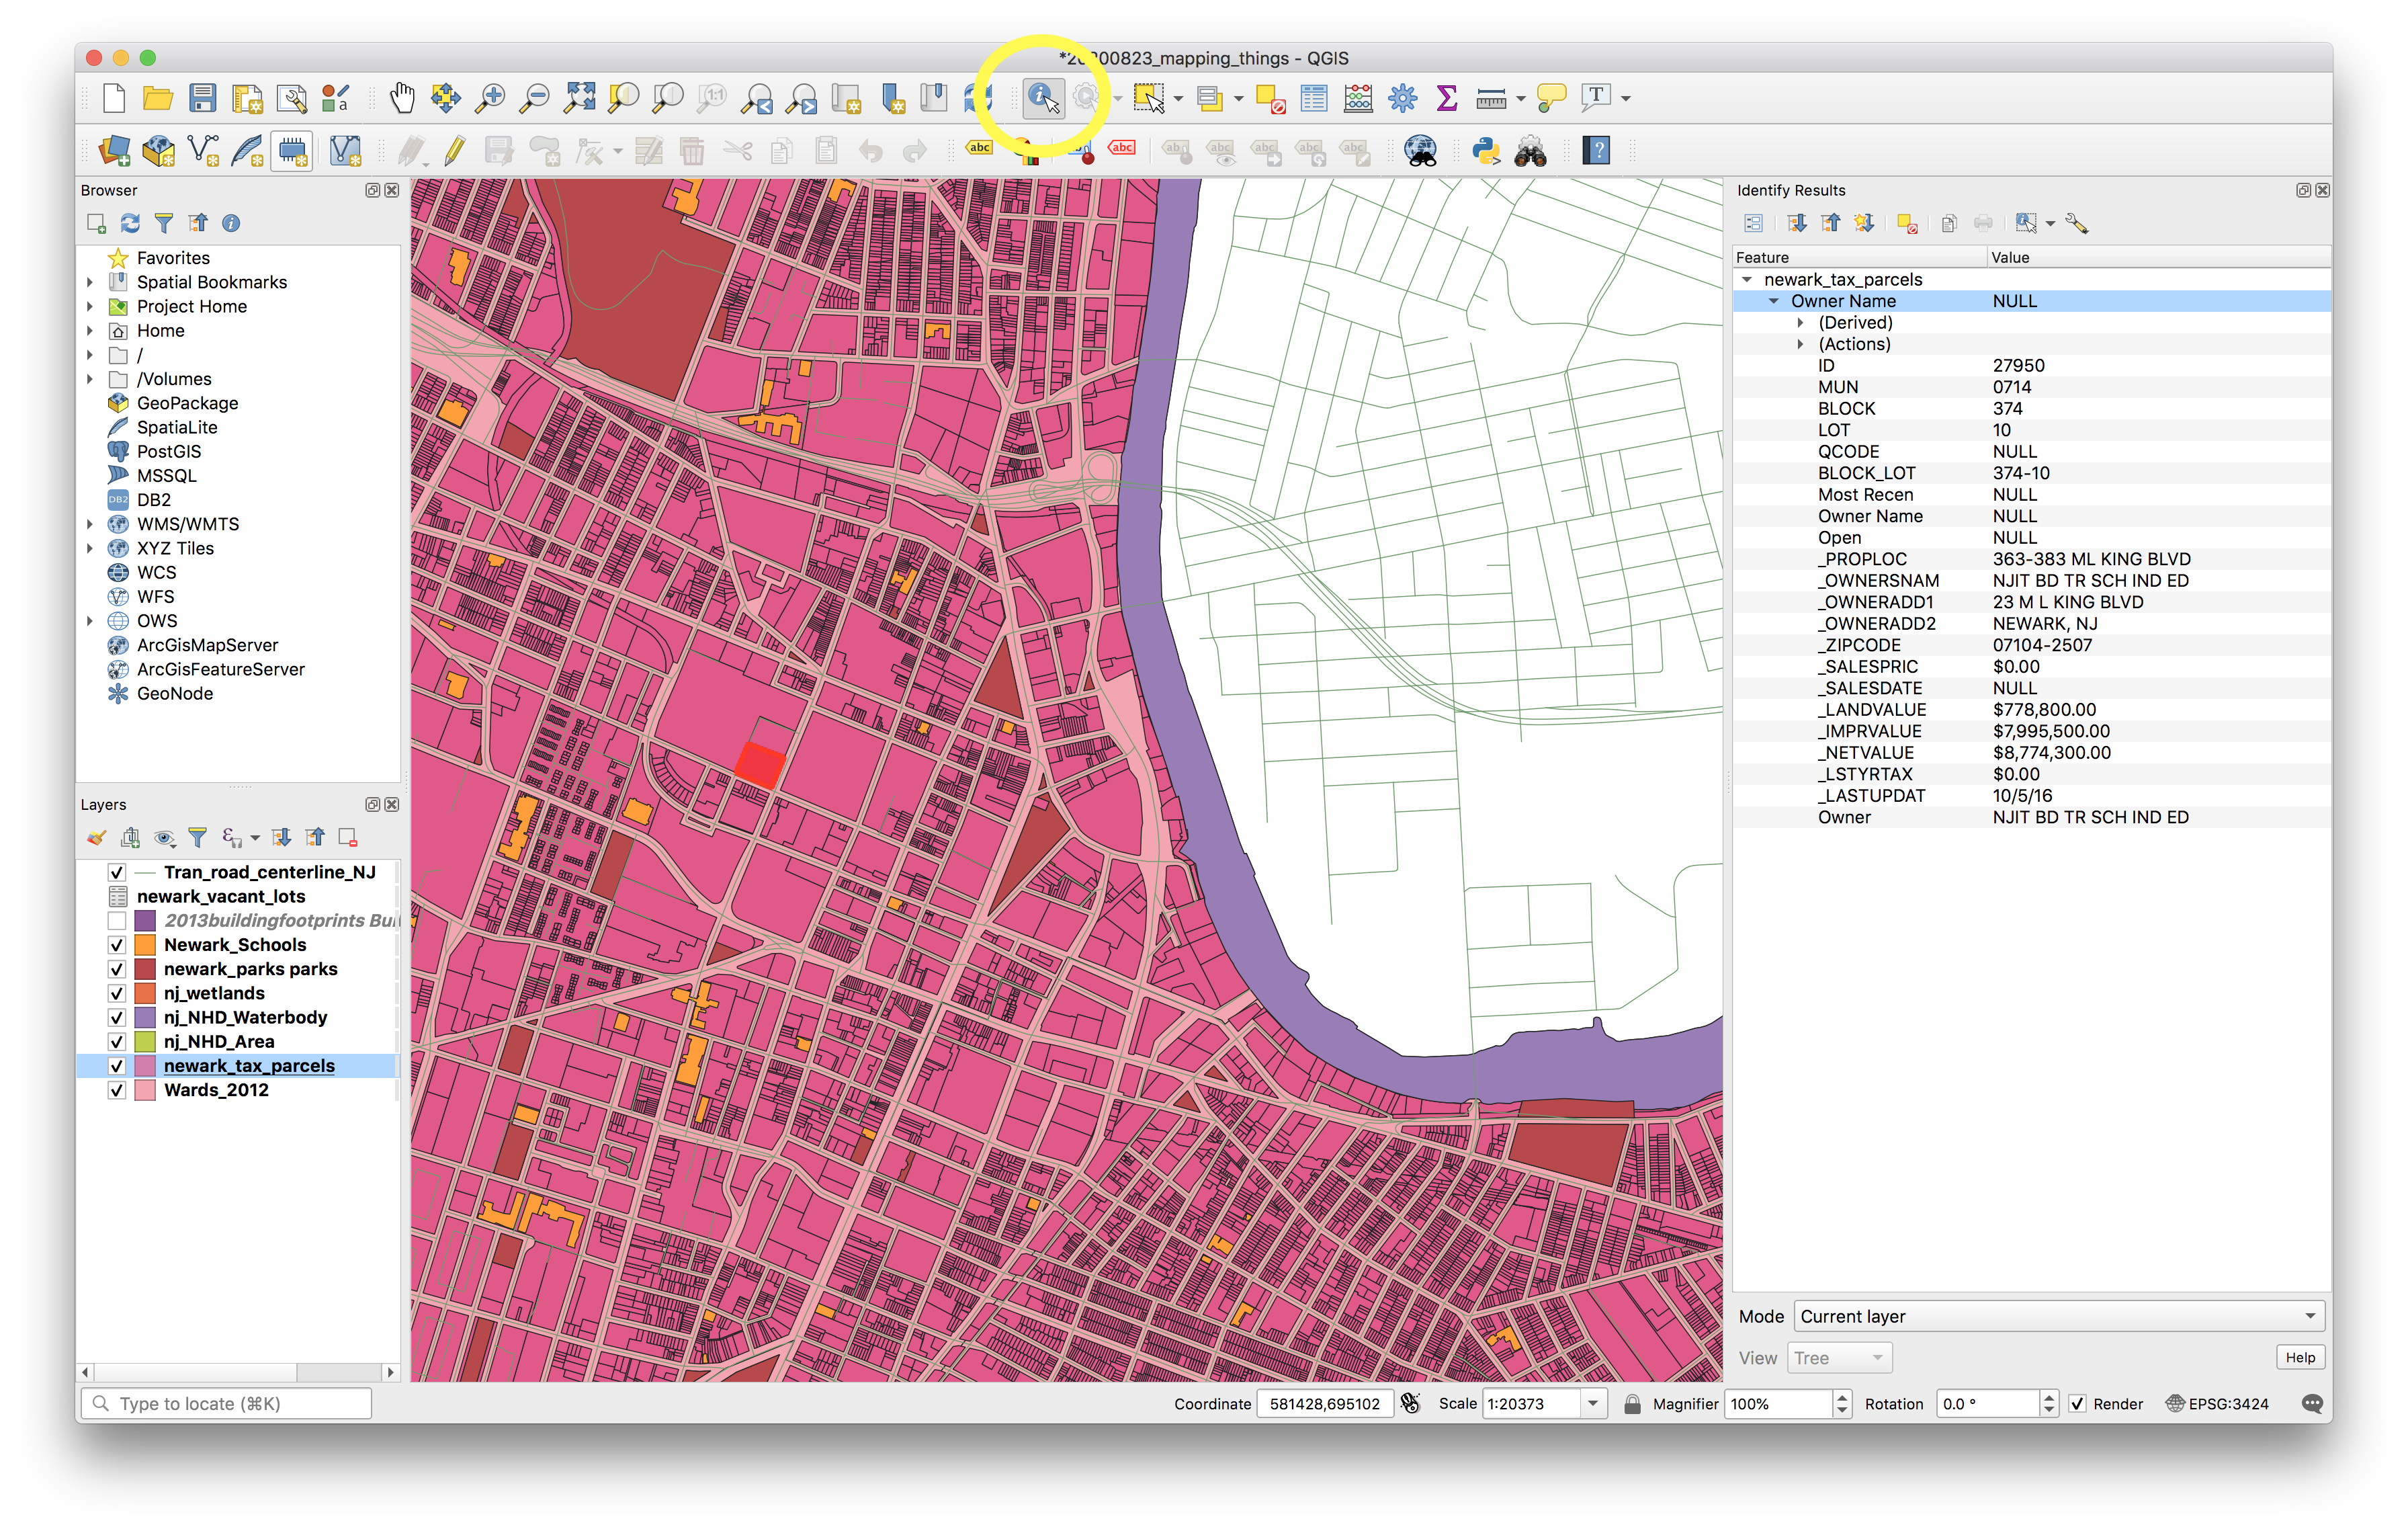
Select the tax parcels layer in the Layers panel. Select the Identify Features tool, and then click on an individual tax parcel (a feature) on the map canvas to inspect the attributes of individual features in the tax parcels layer.
Notice the rows of information that appear in the Identify Results panel. These are the values for one row within the attribute table for the Newark tax parcels layer – i.e. the values for one feature in the tax parcel feature class. Each row in the attribute table corresponds to one feature on the map.
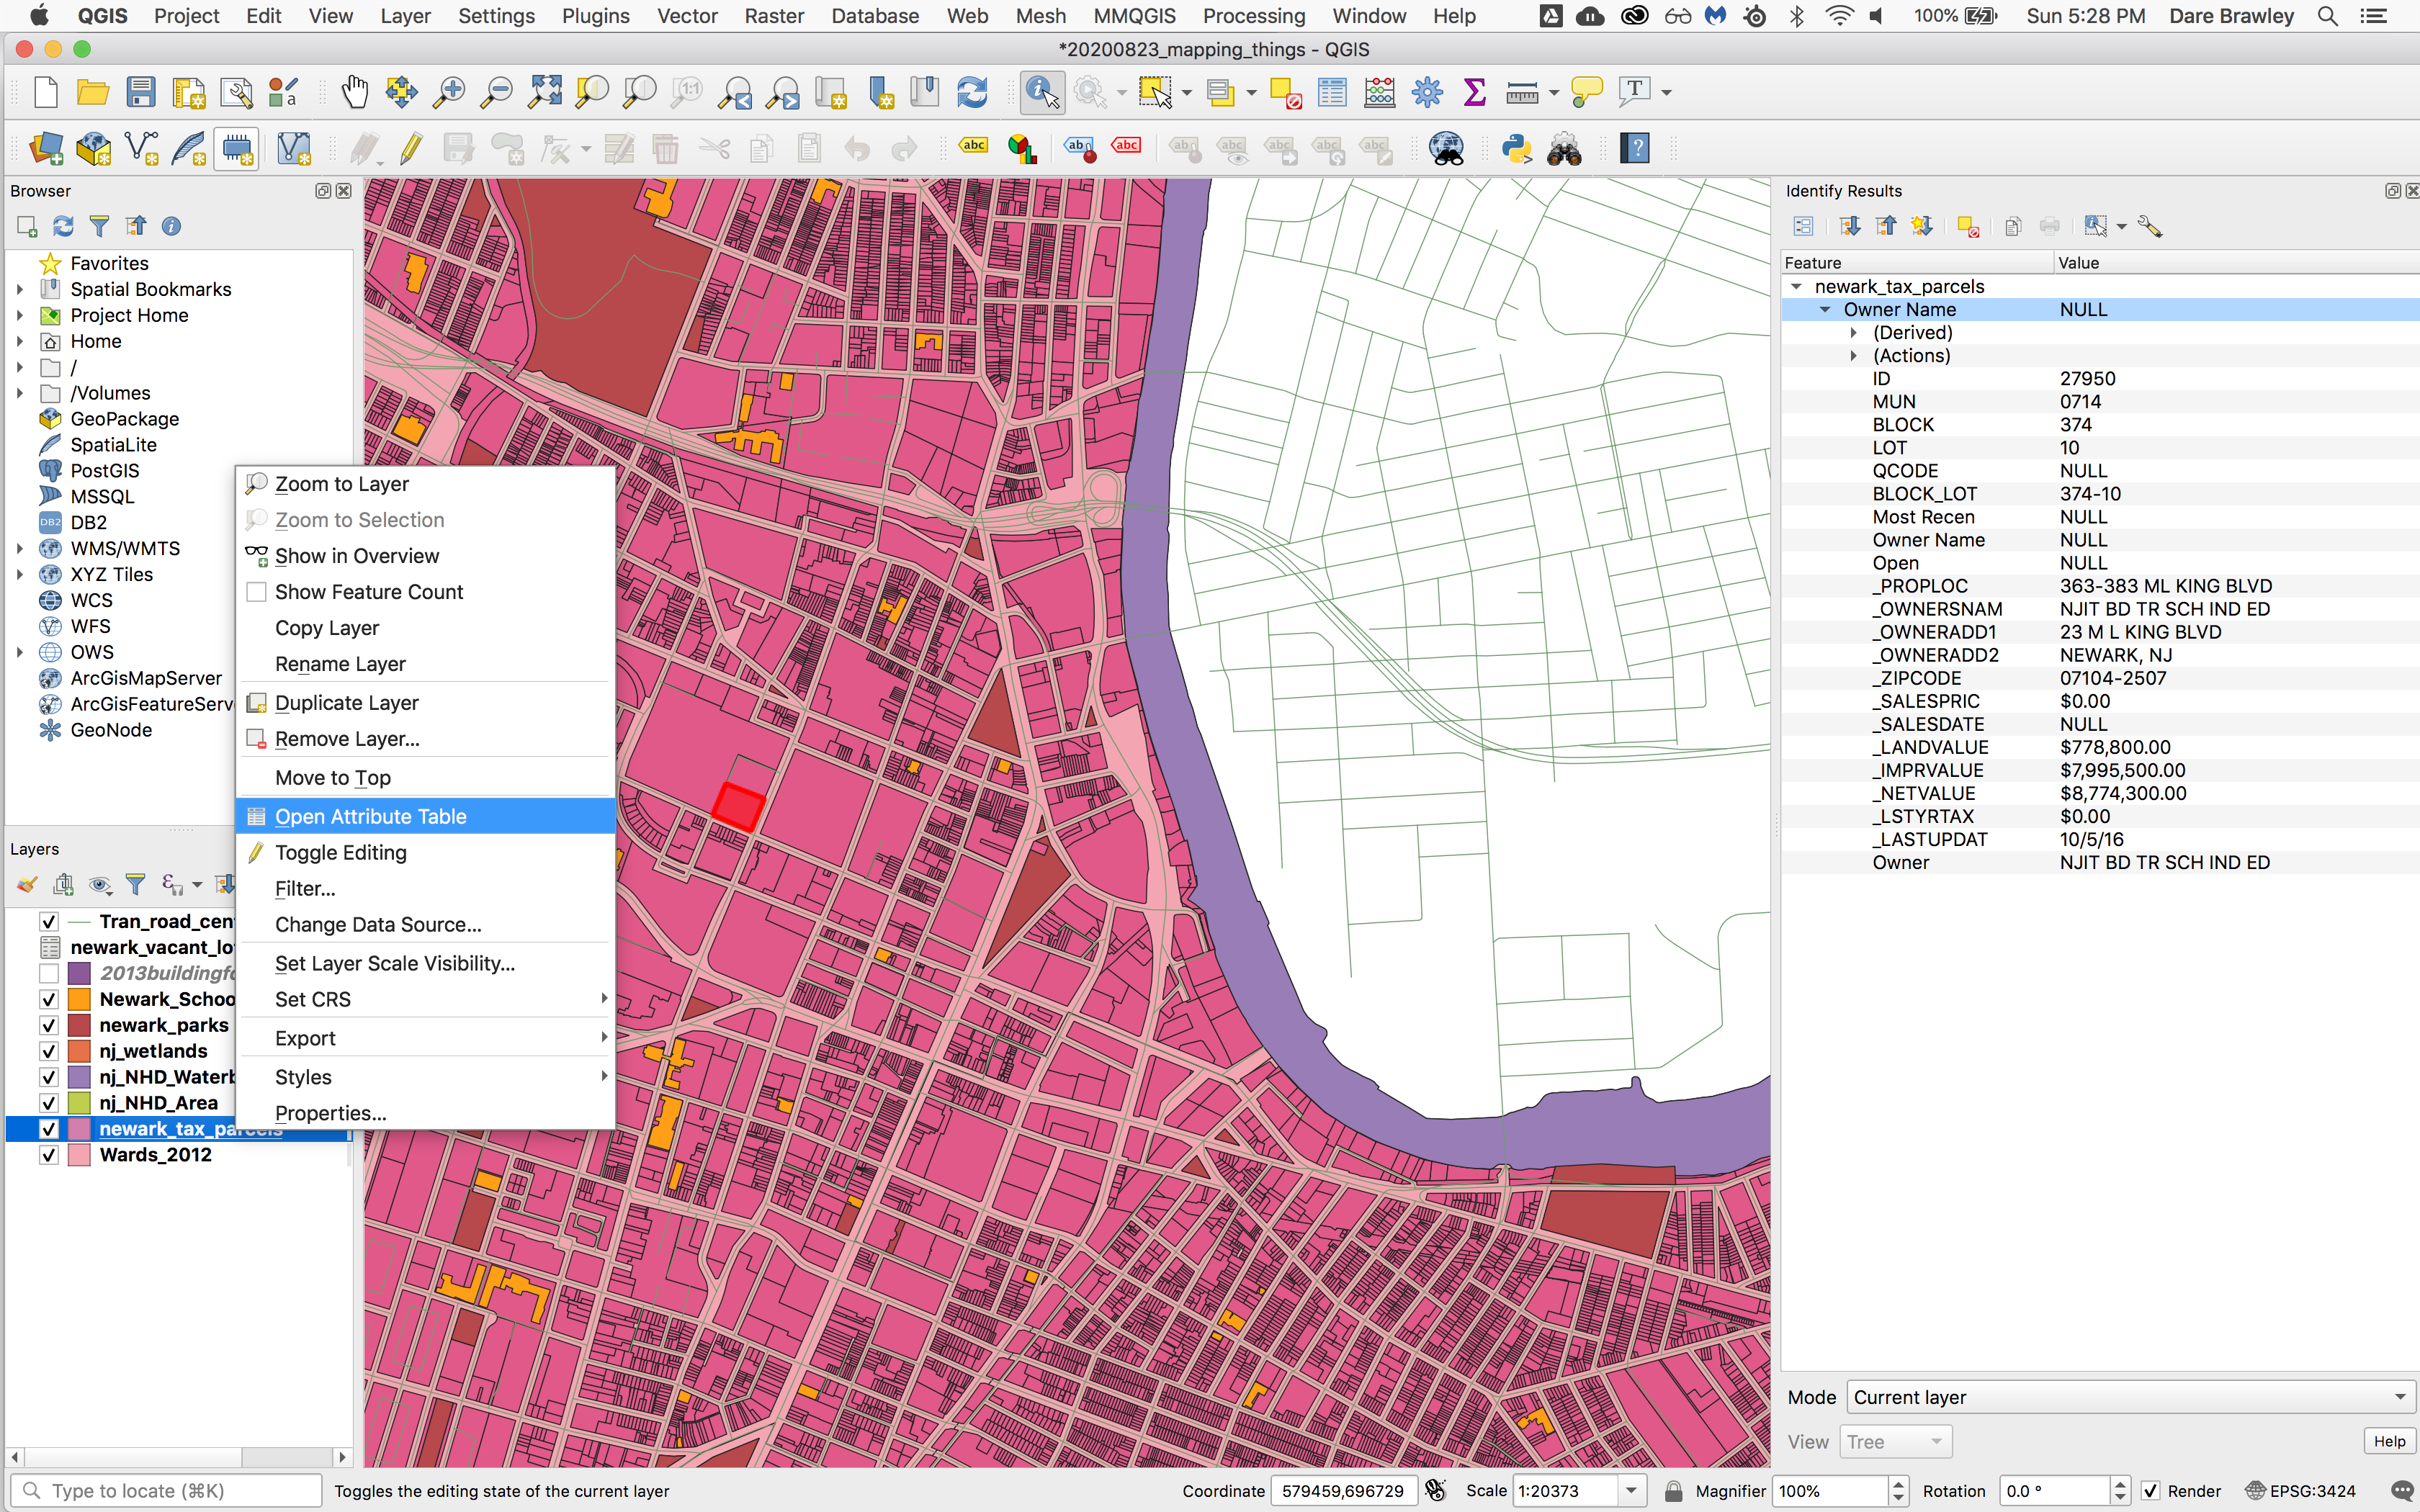
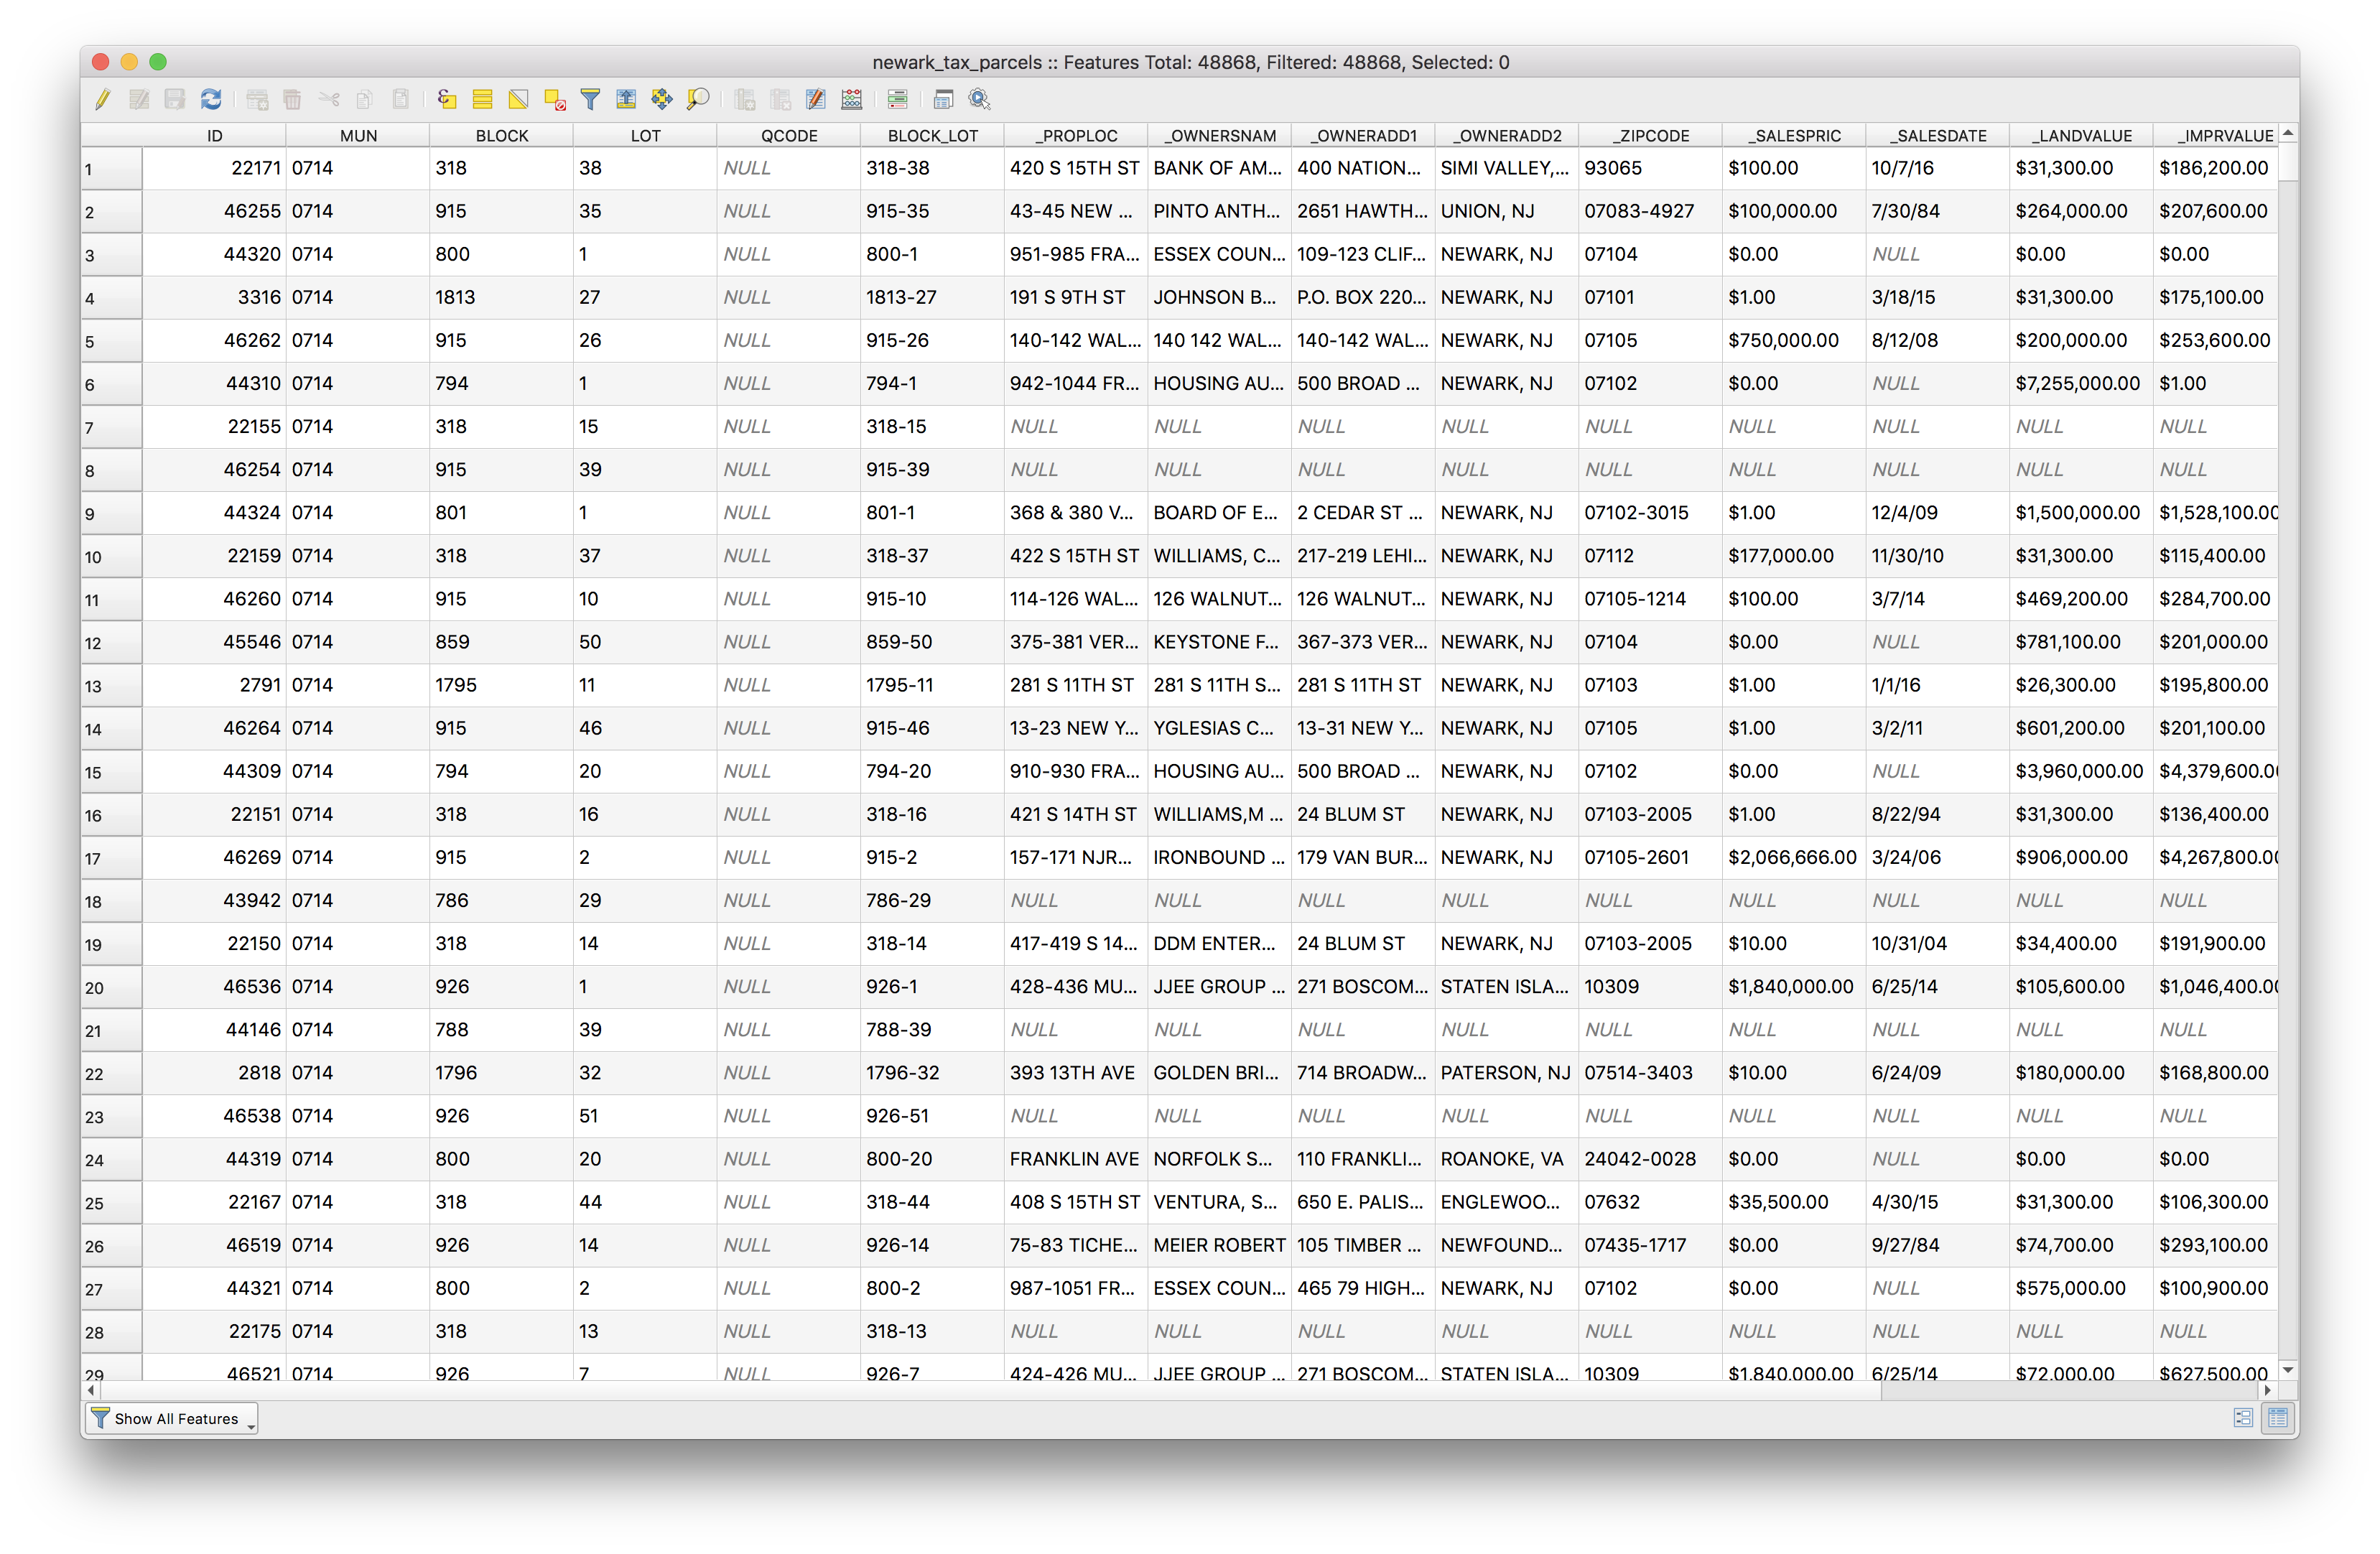
 Now lets open the full attribute table for the tax parcels.
Right click on the tax parcels layer in the Layers panel. Select Open Attribute Table.
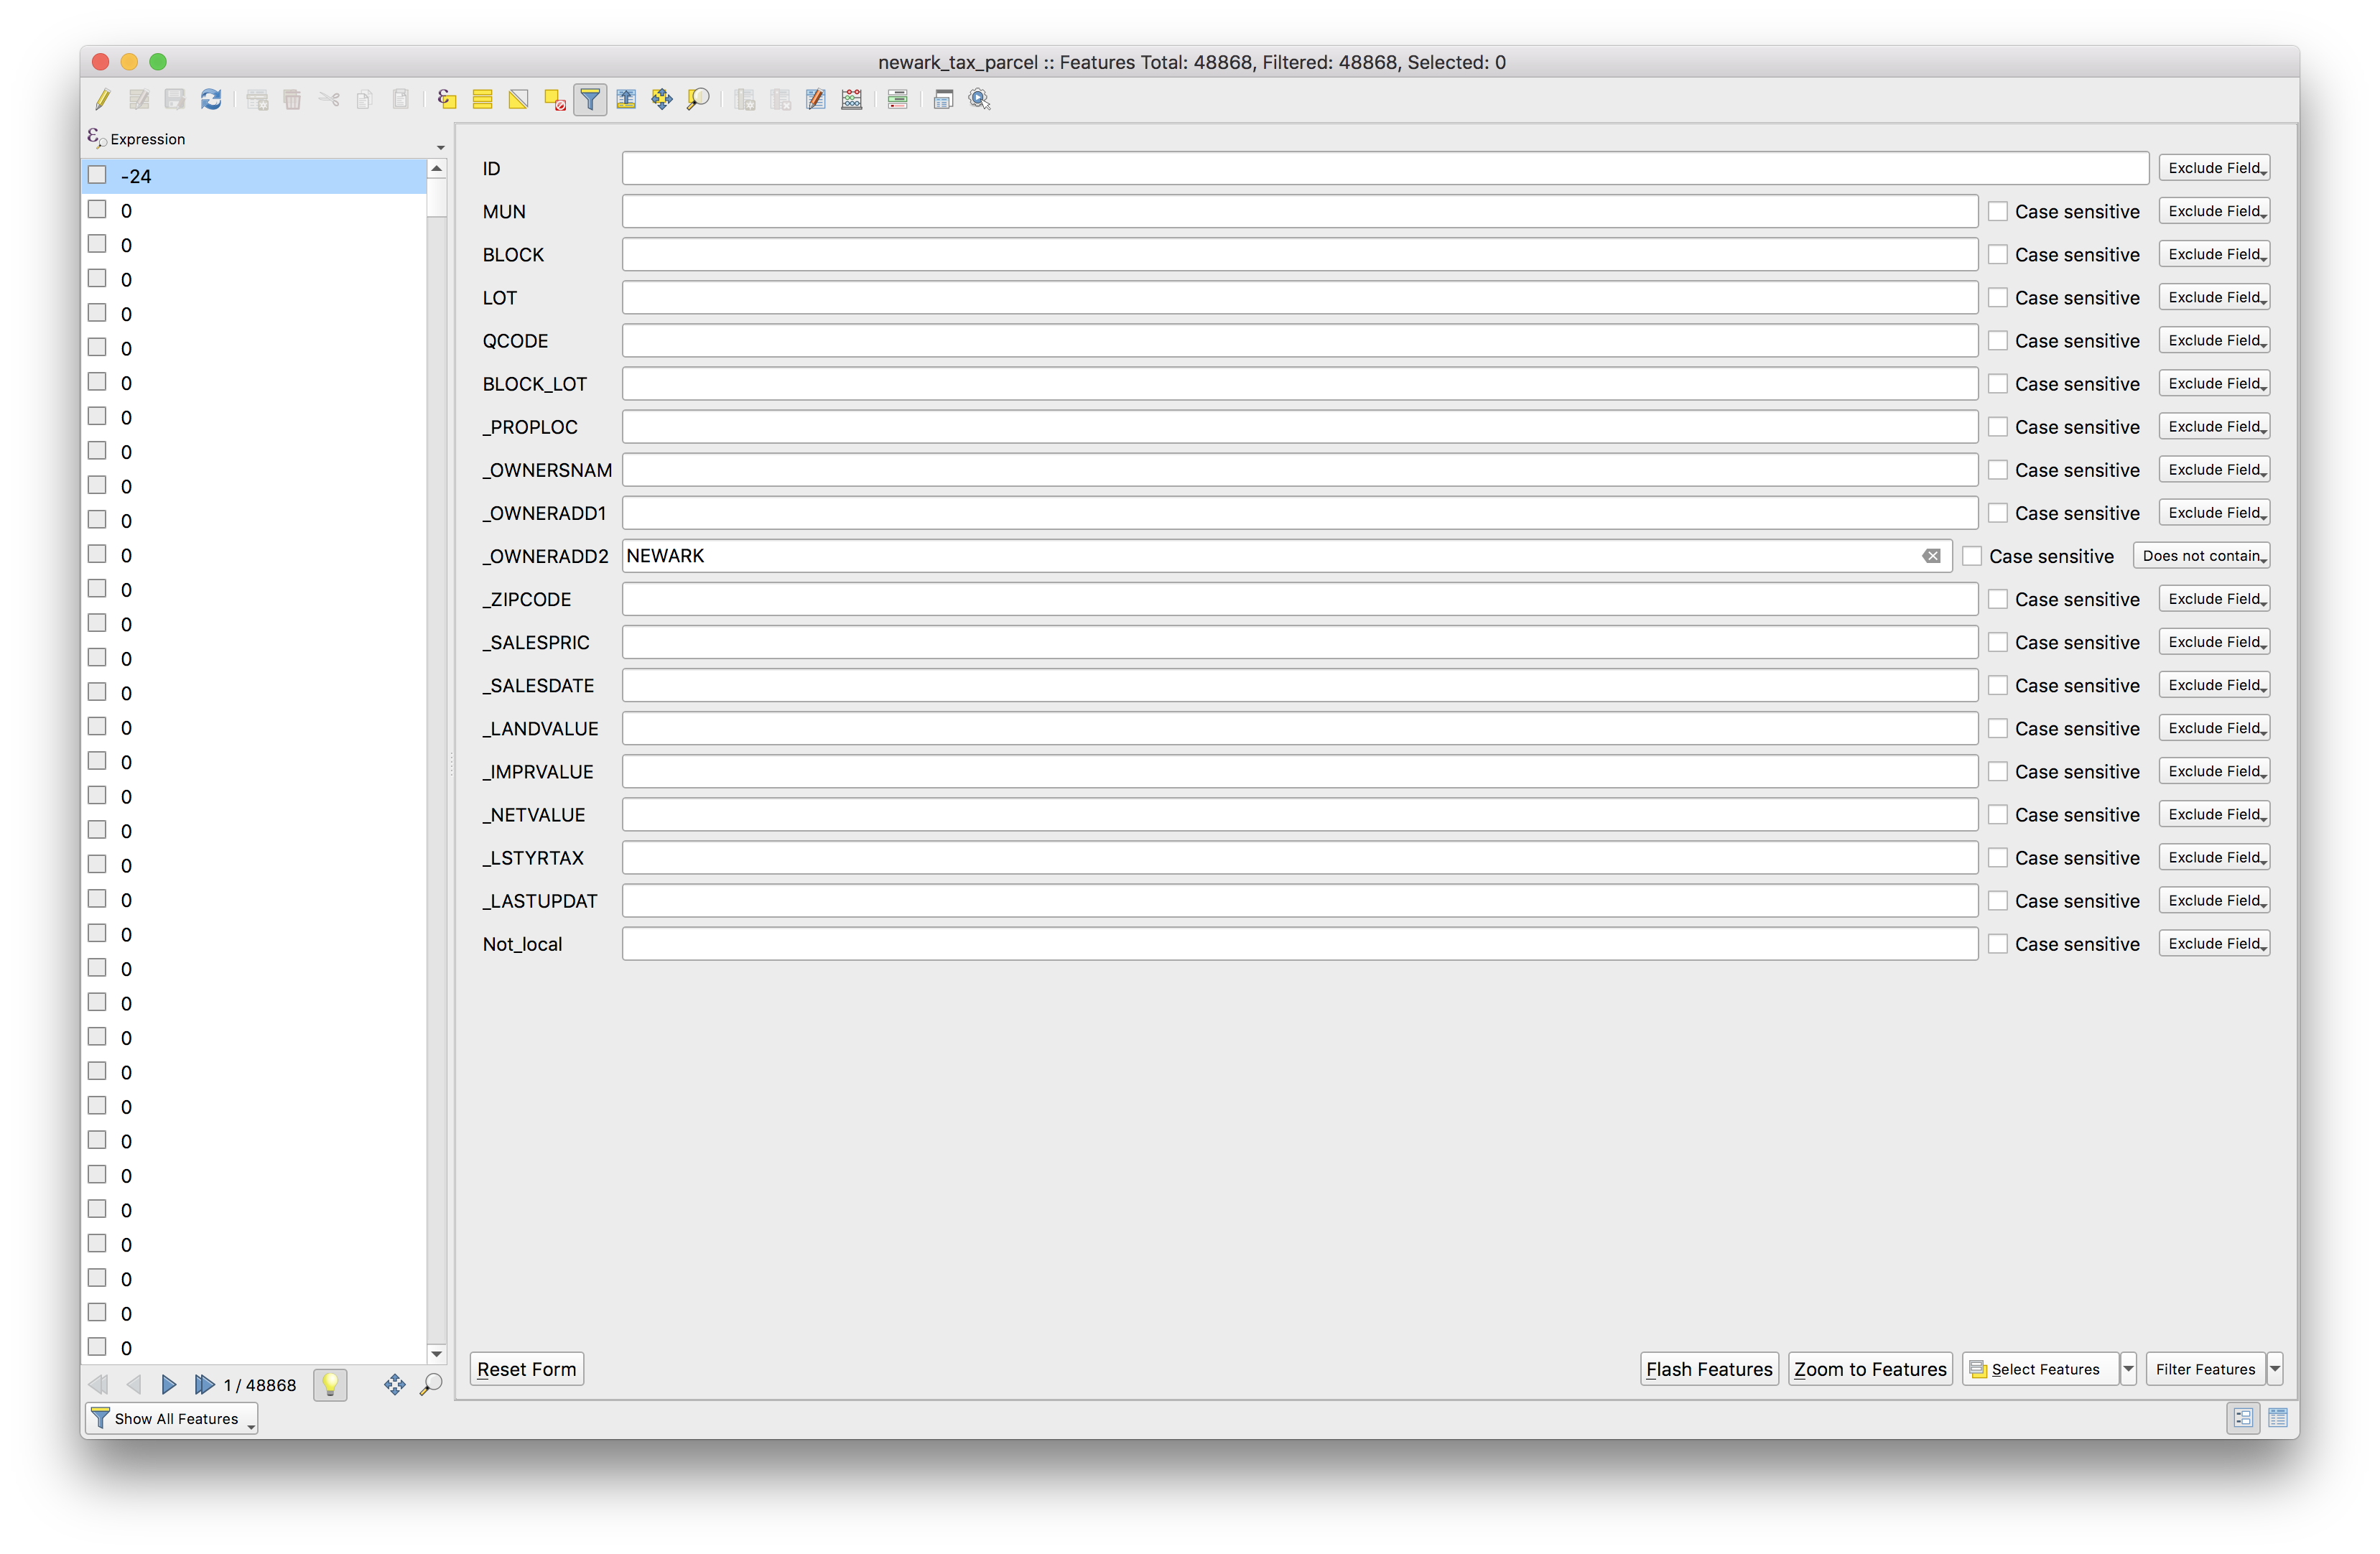
Notice all of the fields (i.e. columns) in the attribute table. The _OWNERADD2 field contains the city and state of the address listed for the recorded owner of the tax parcel. We will use this field to select all parcels where this field does not contain the word NEWARK.
Click the Select/filter features using form tool and make the following selections, then click select features.
To return to the table view click the Swith to table view button in the bottom right.
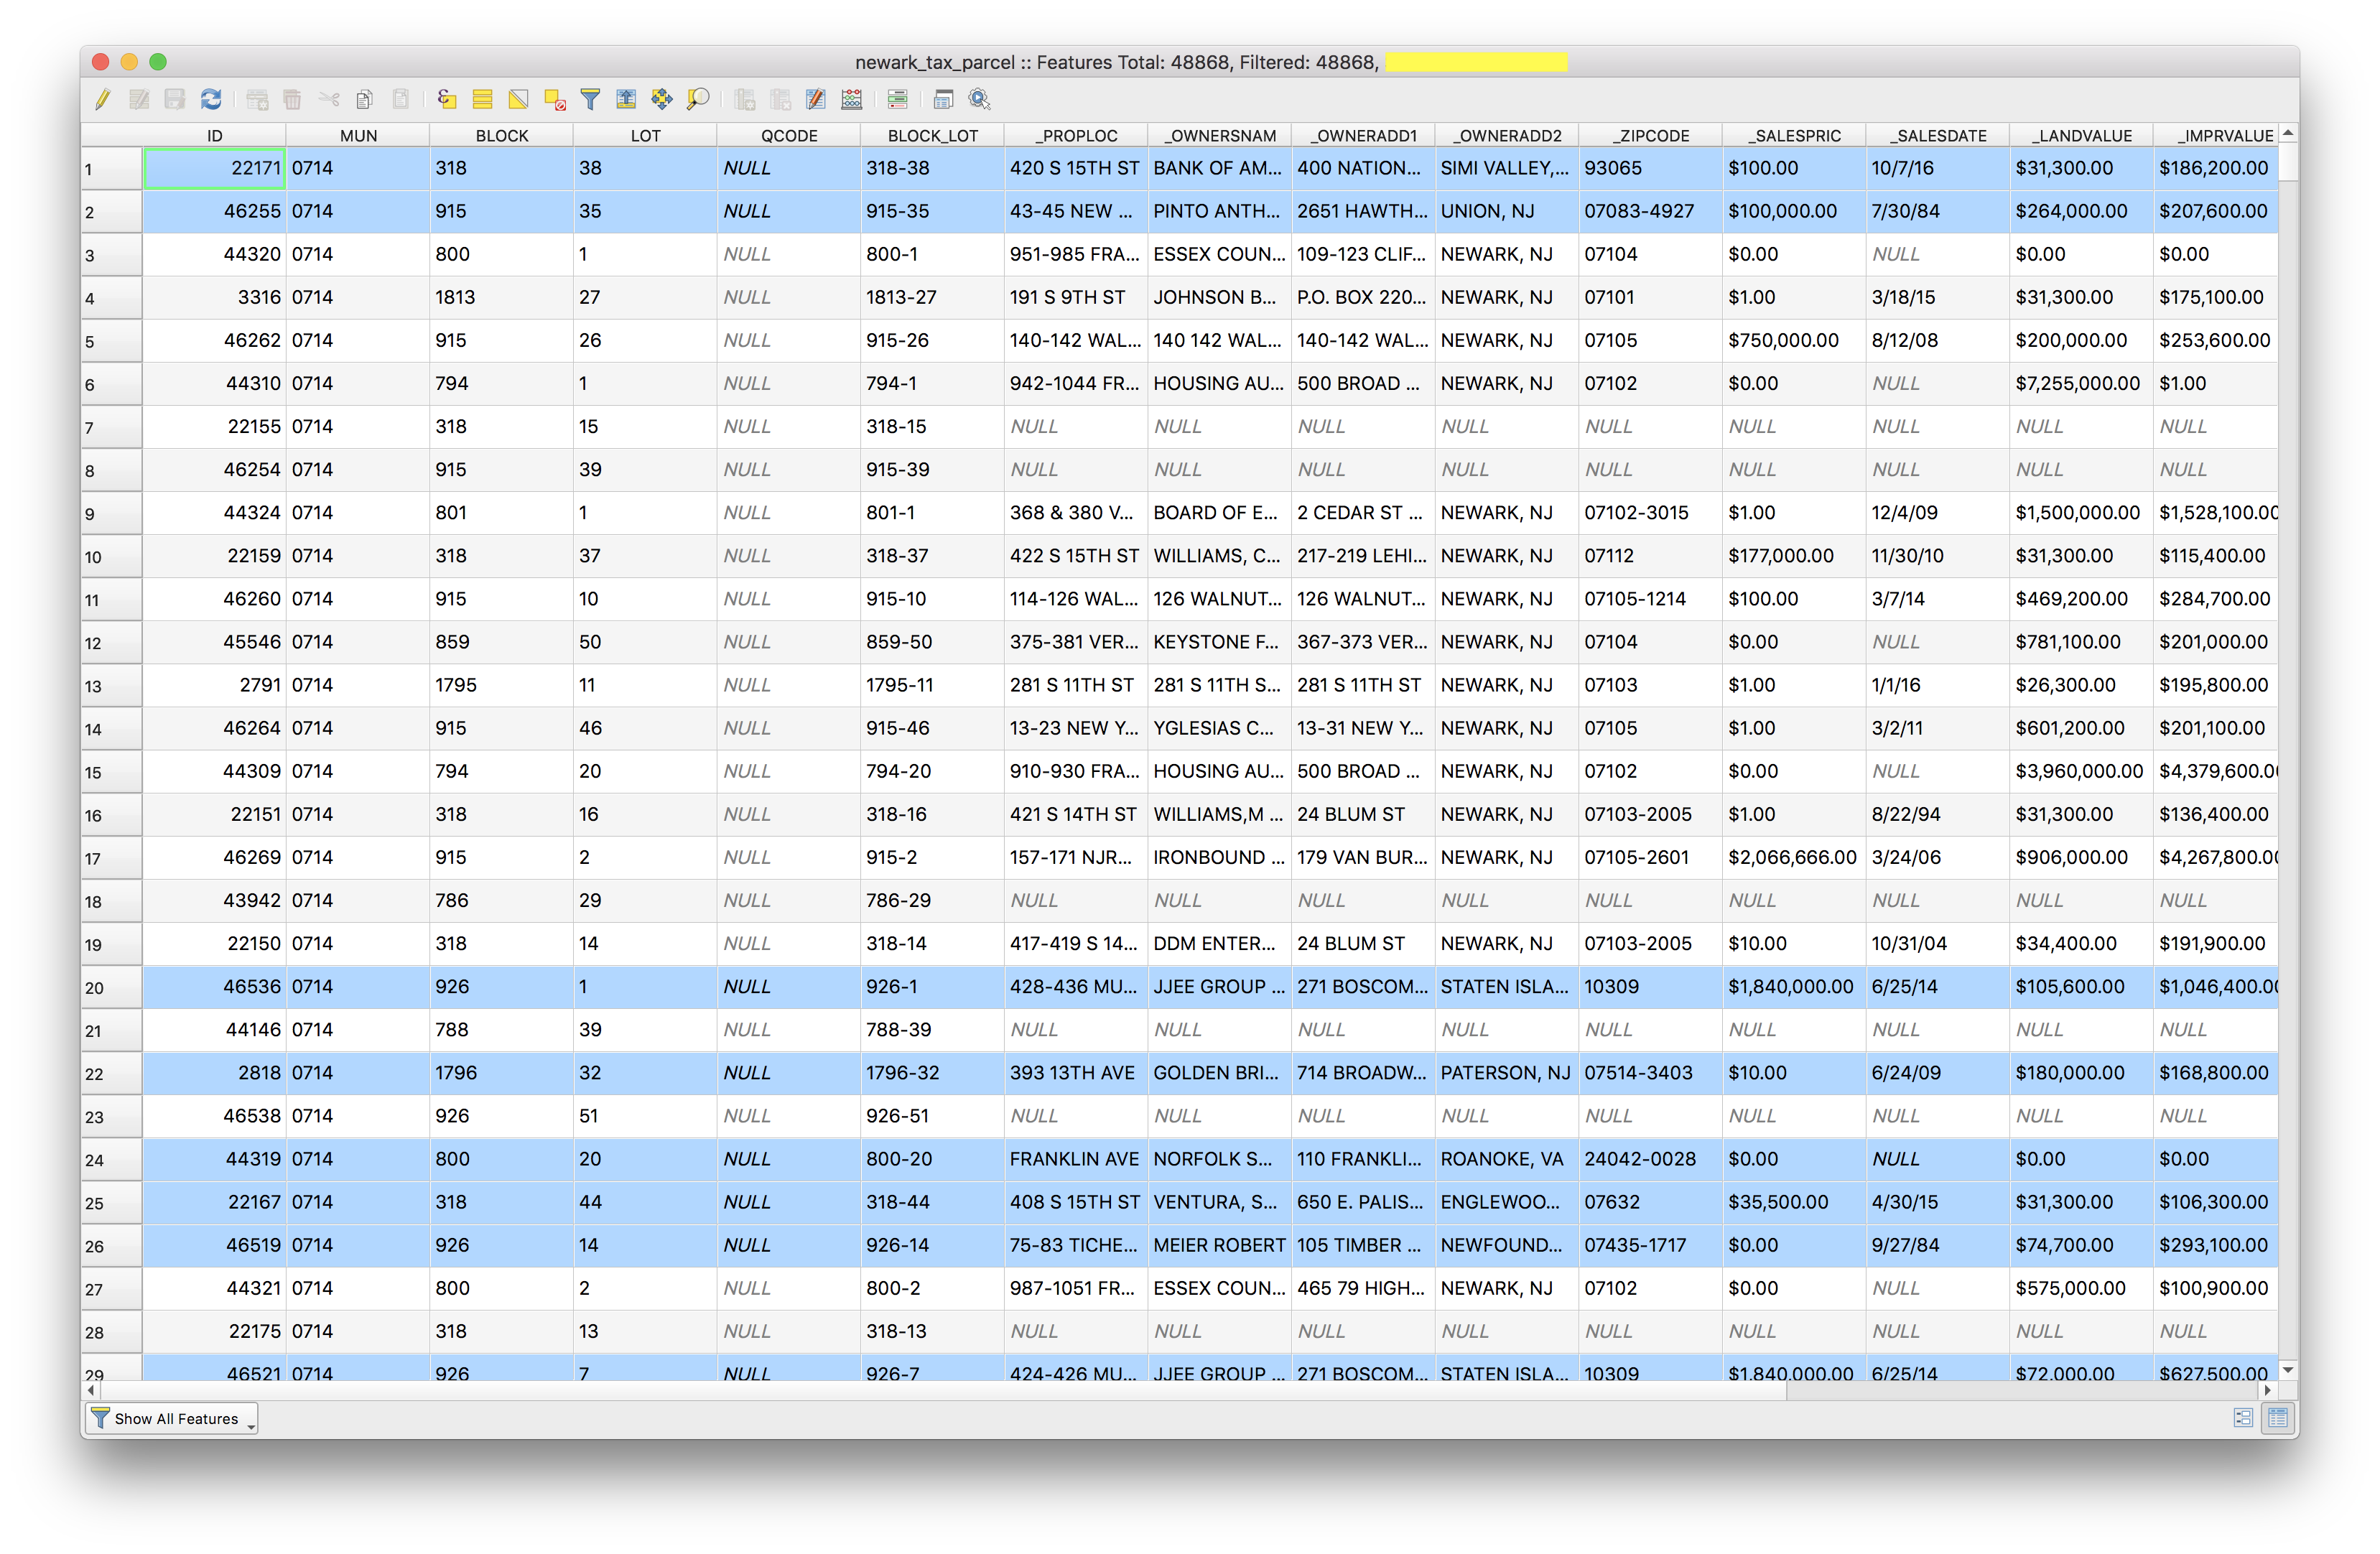
Click the Show selected features option in the bottom left to see all the selected features.
How many tax parcels appear to be owned by entities who do not reside in newark? This is visible in the top bar of the attribute table. Note this answer, you will be required to turn it in with your assignment.
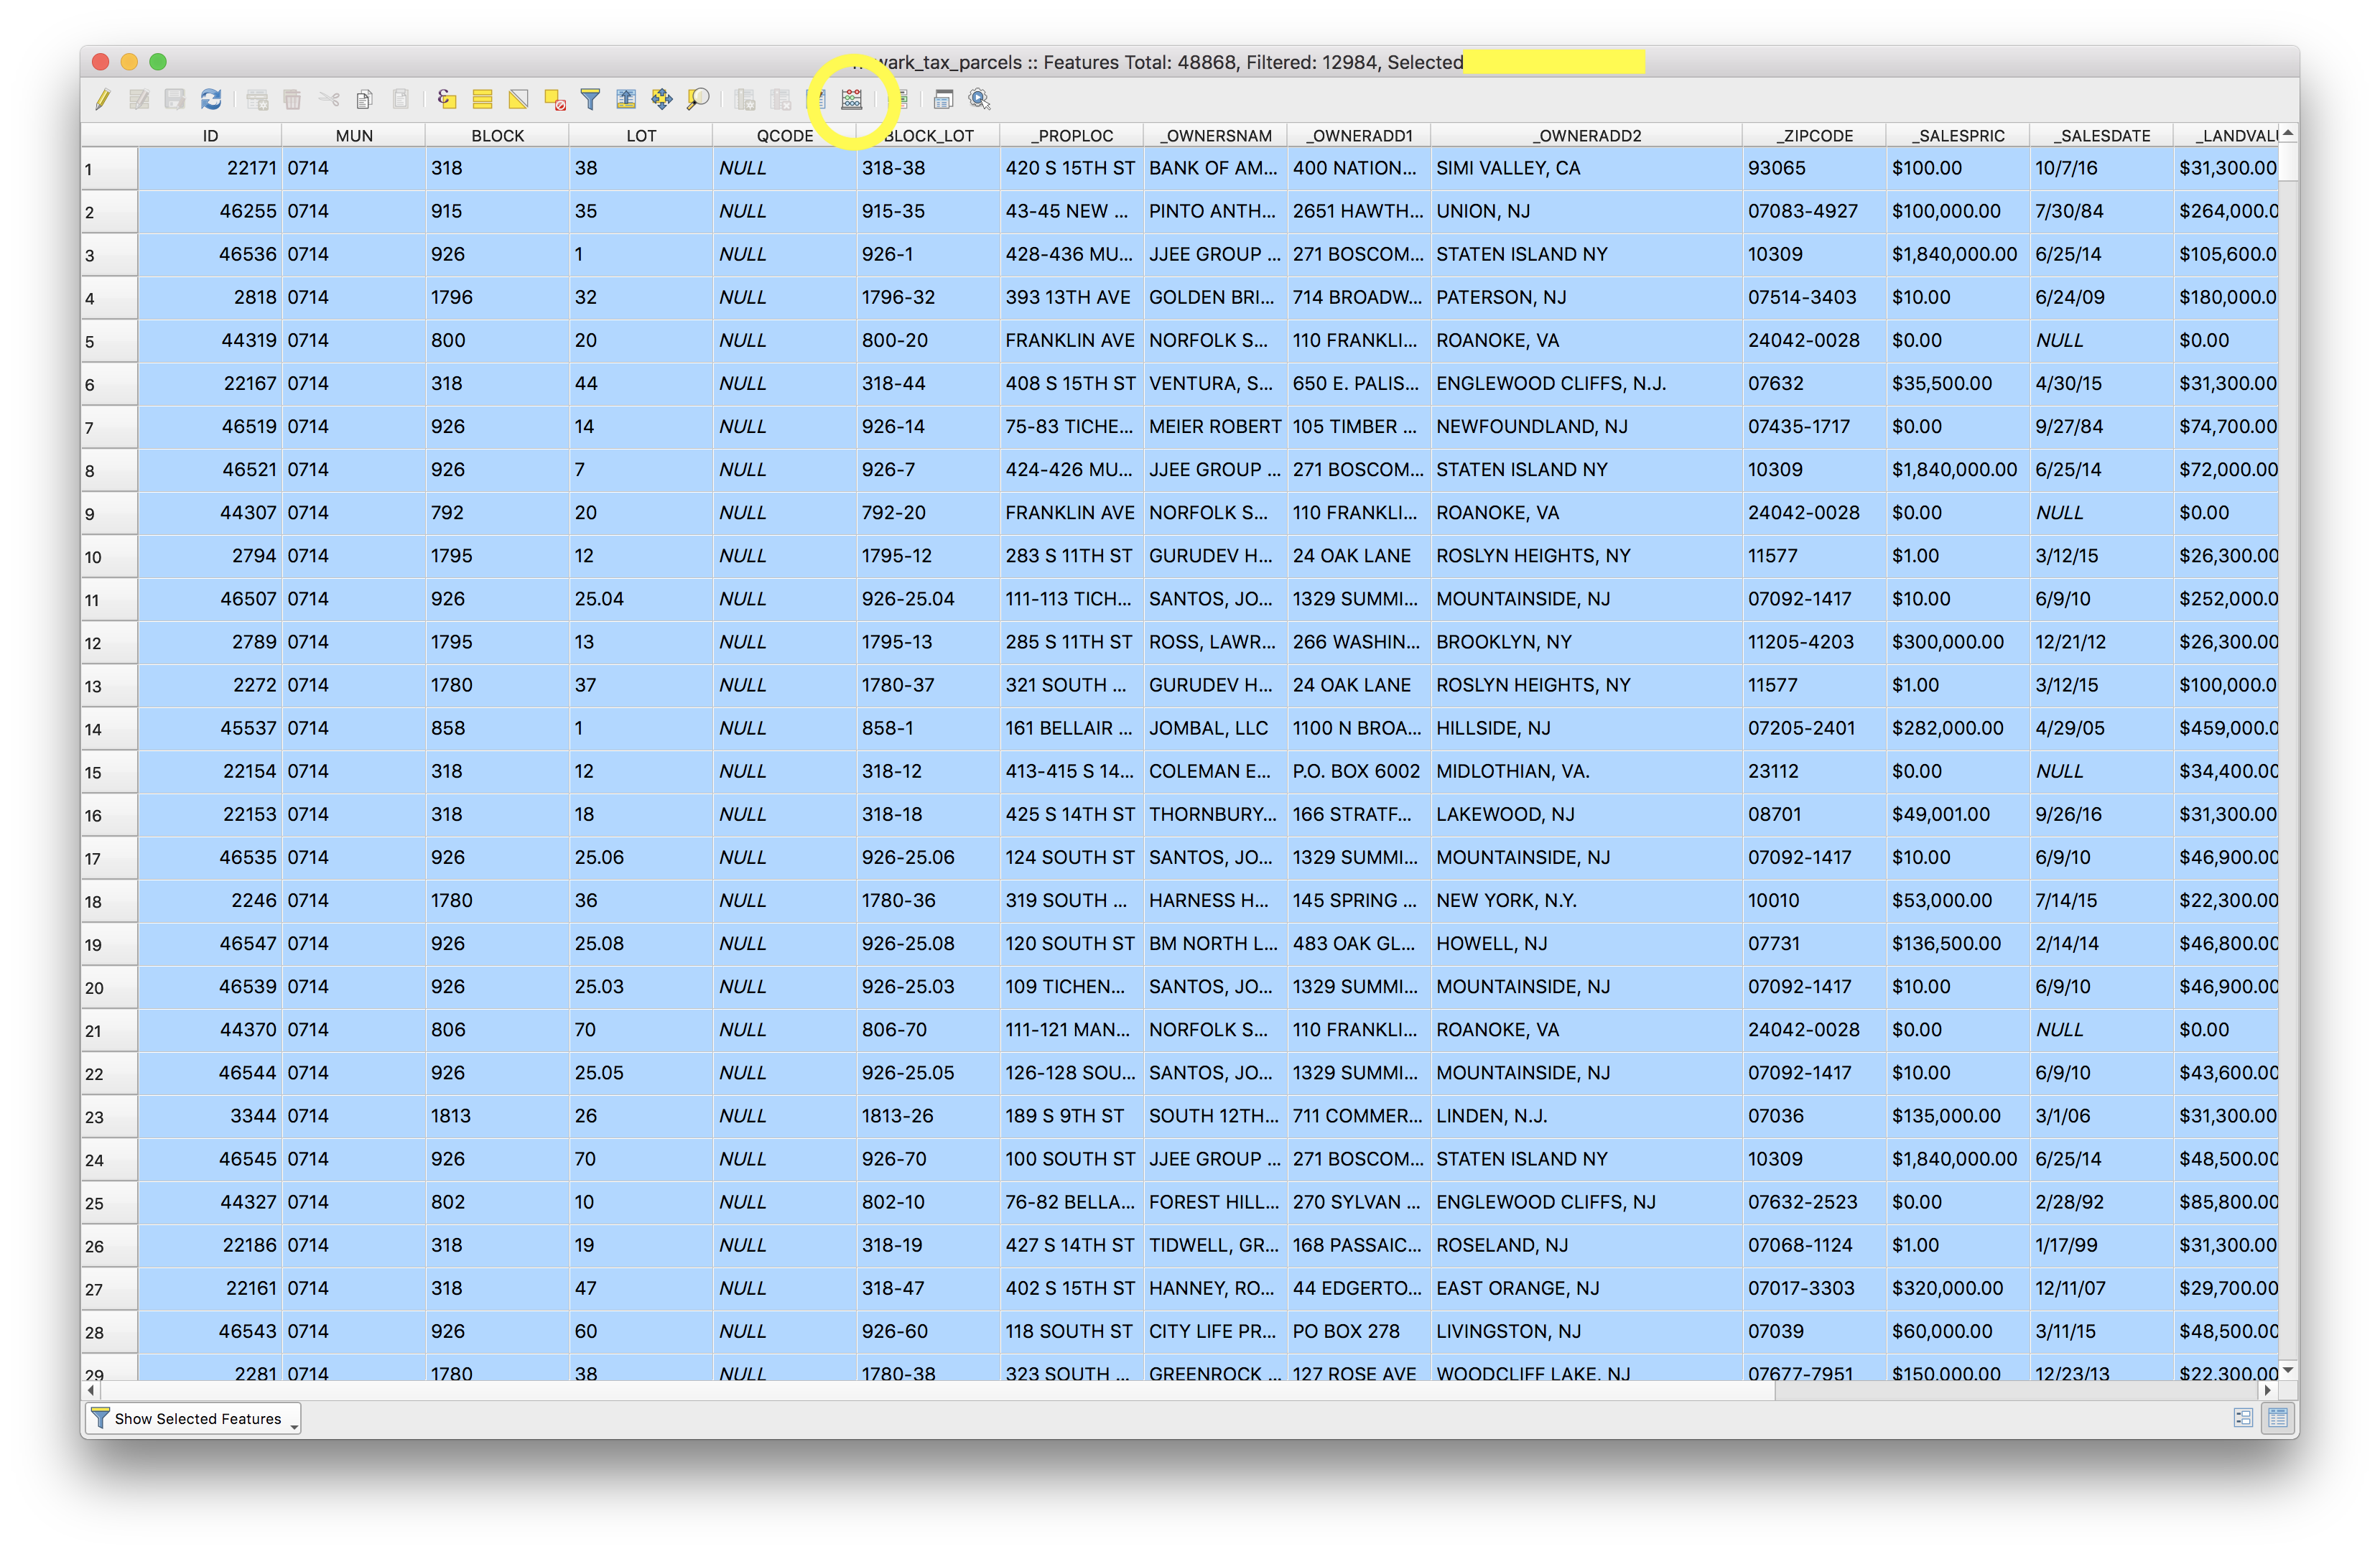
Now lets create a new field (column) in the attribute table that indicates that the owner’s address is not located in Newark so we can access this information more easily in the future.
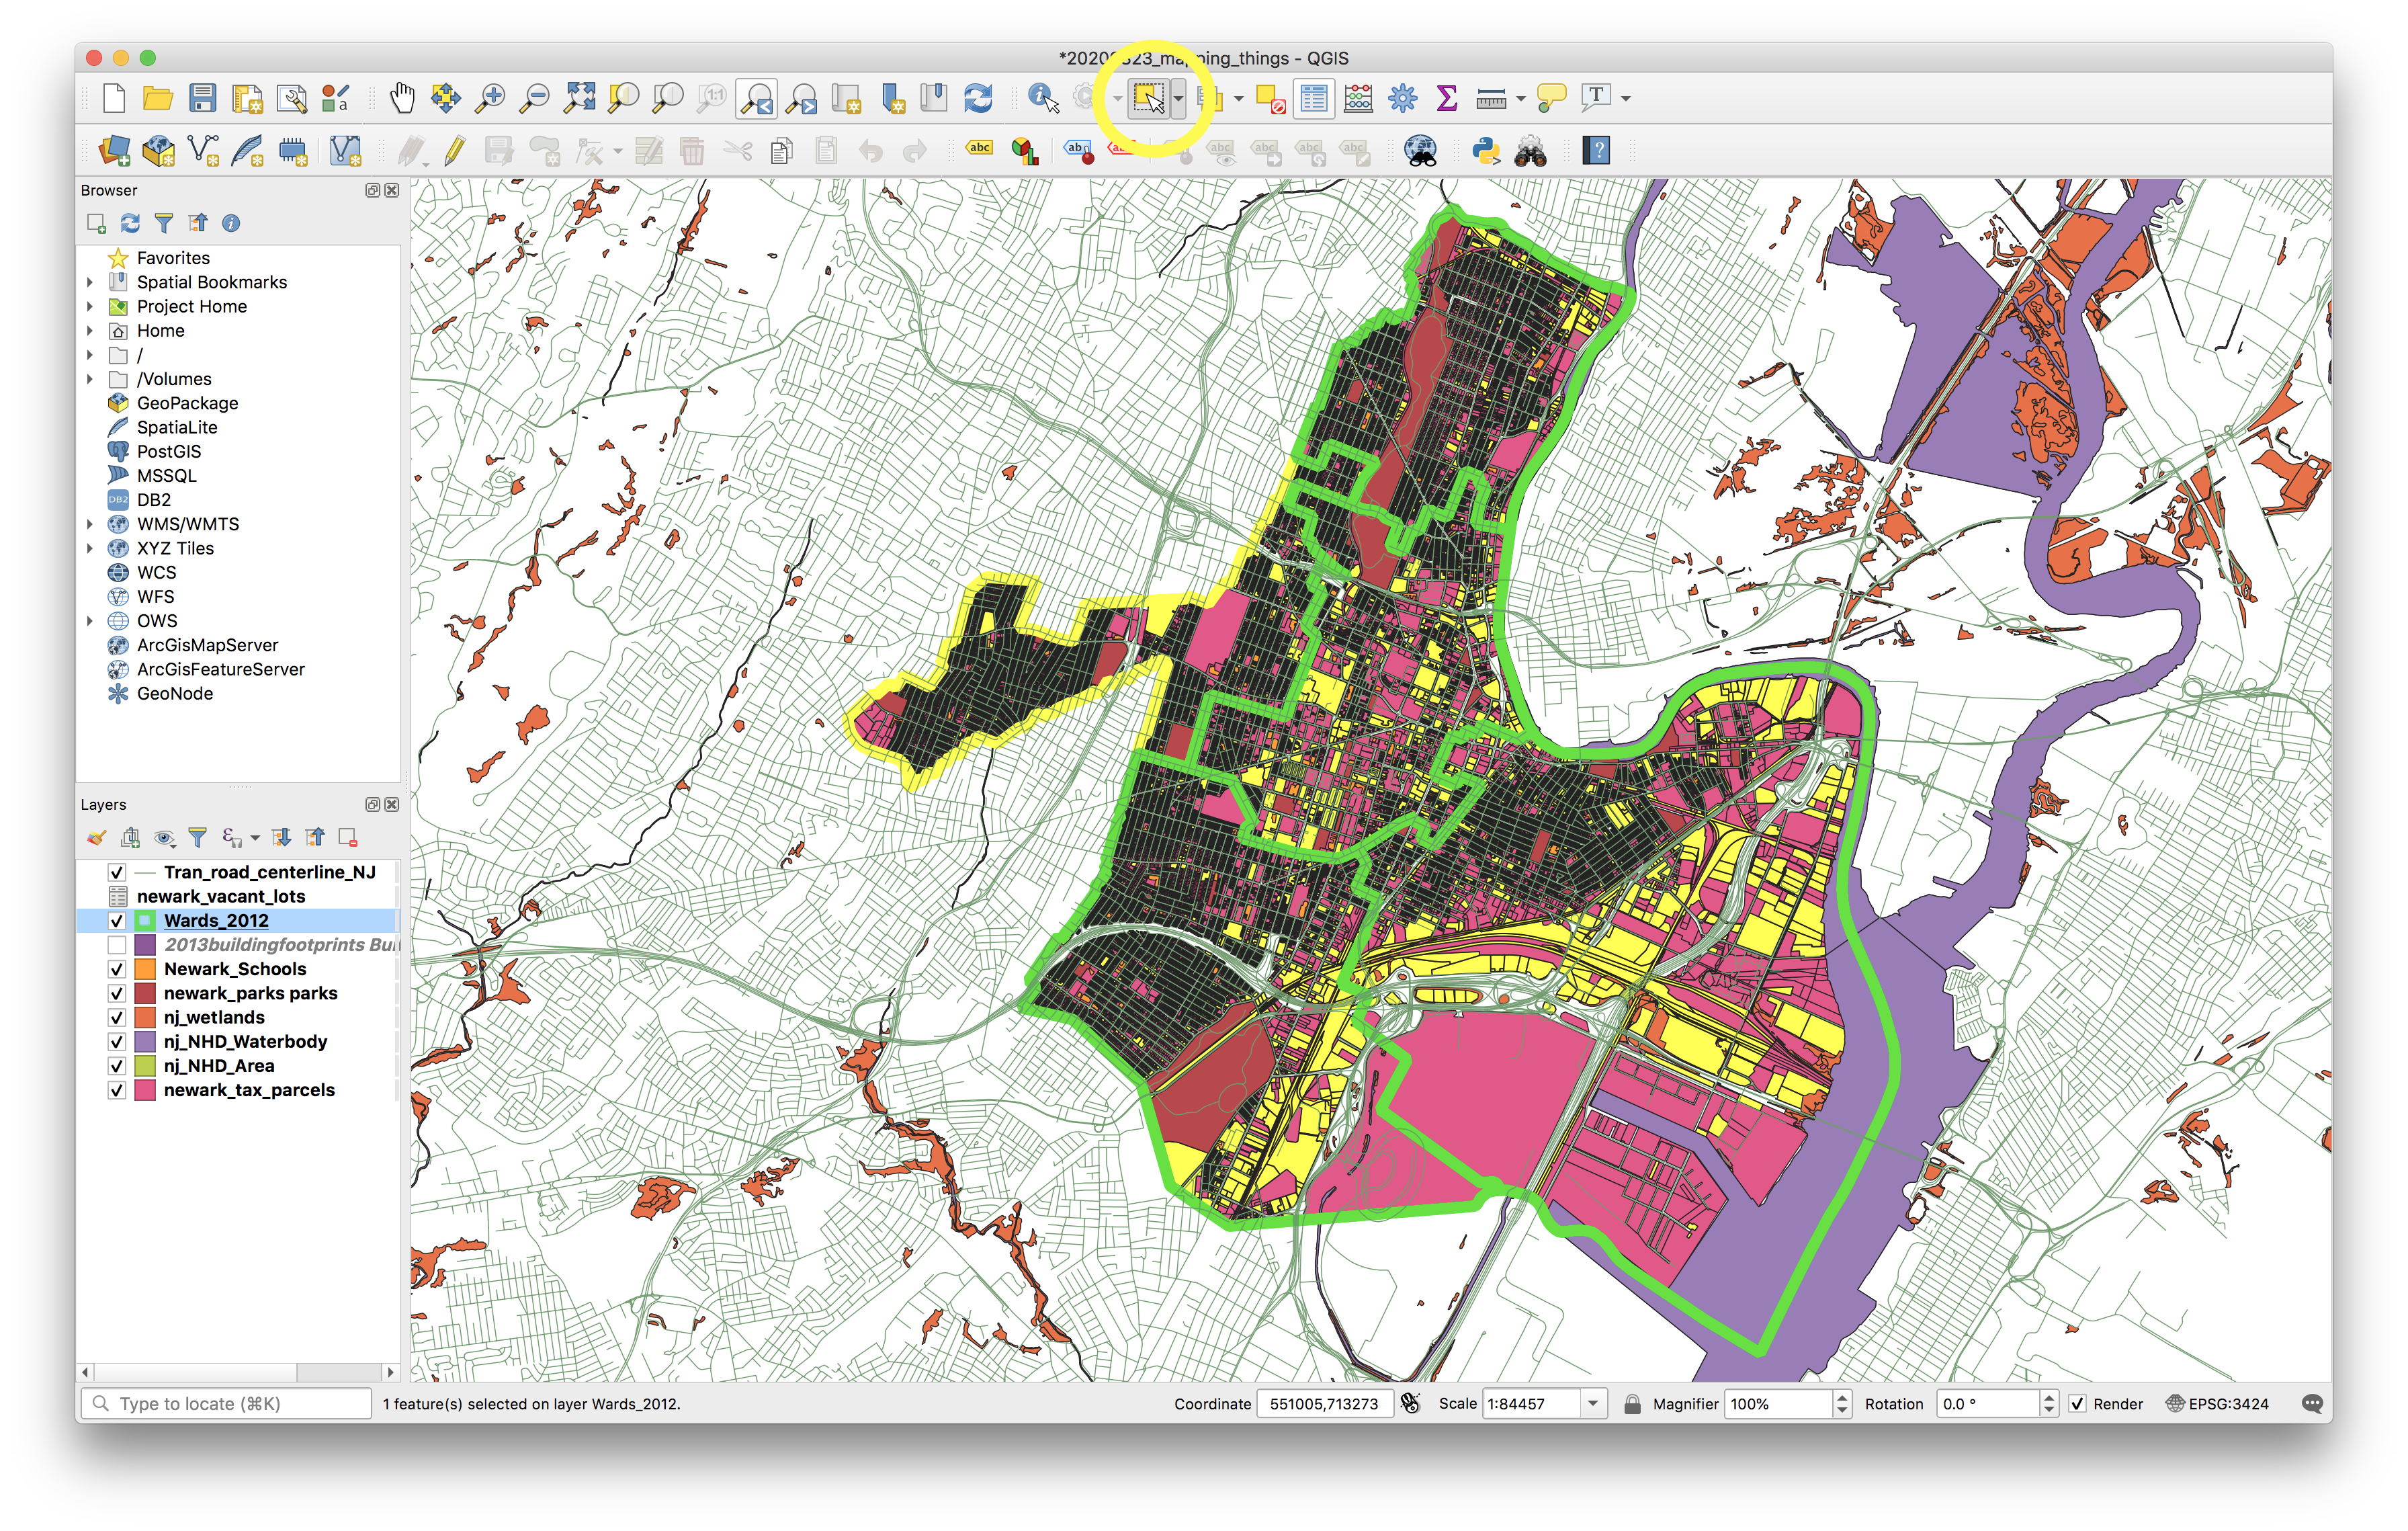
To do this use the Field calculator, accessed via the button circled in yellow in the screenshot above.
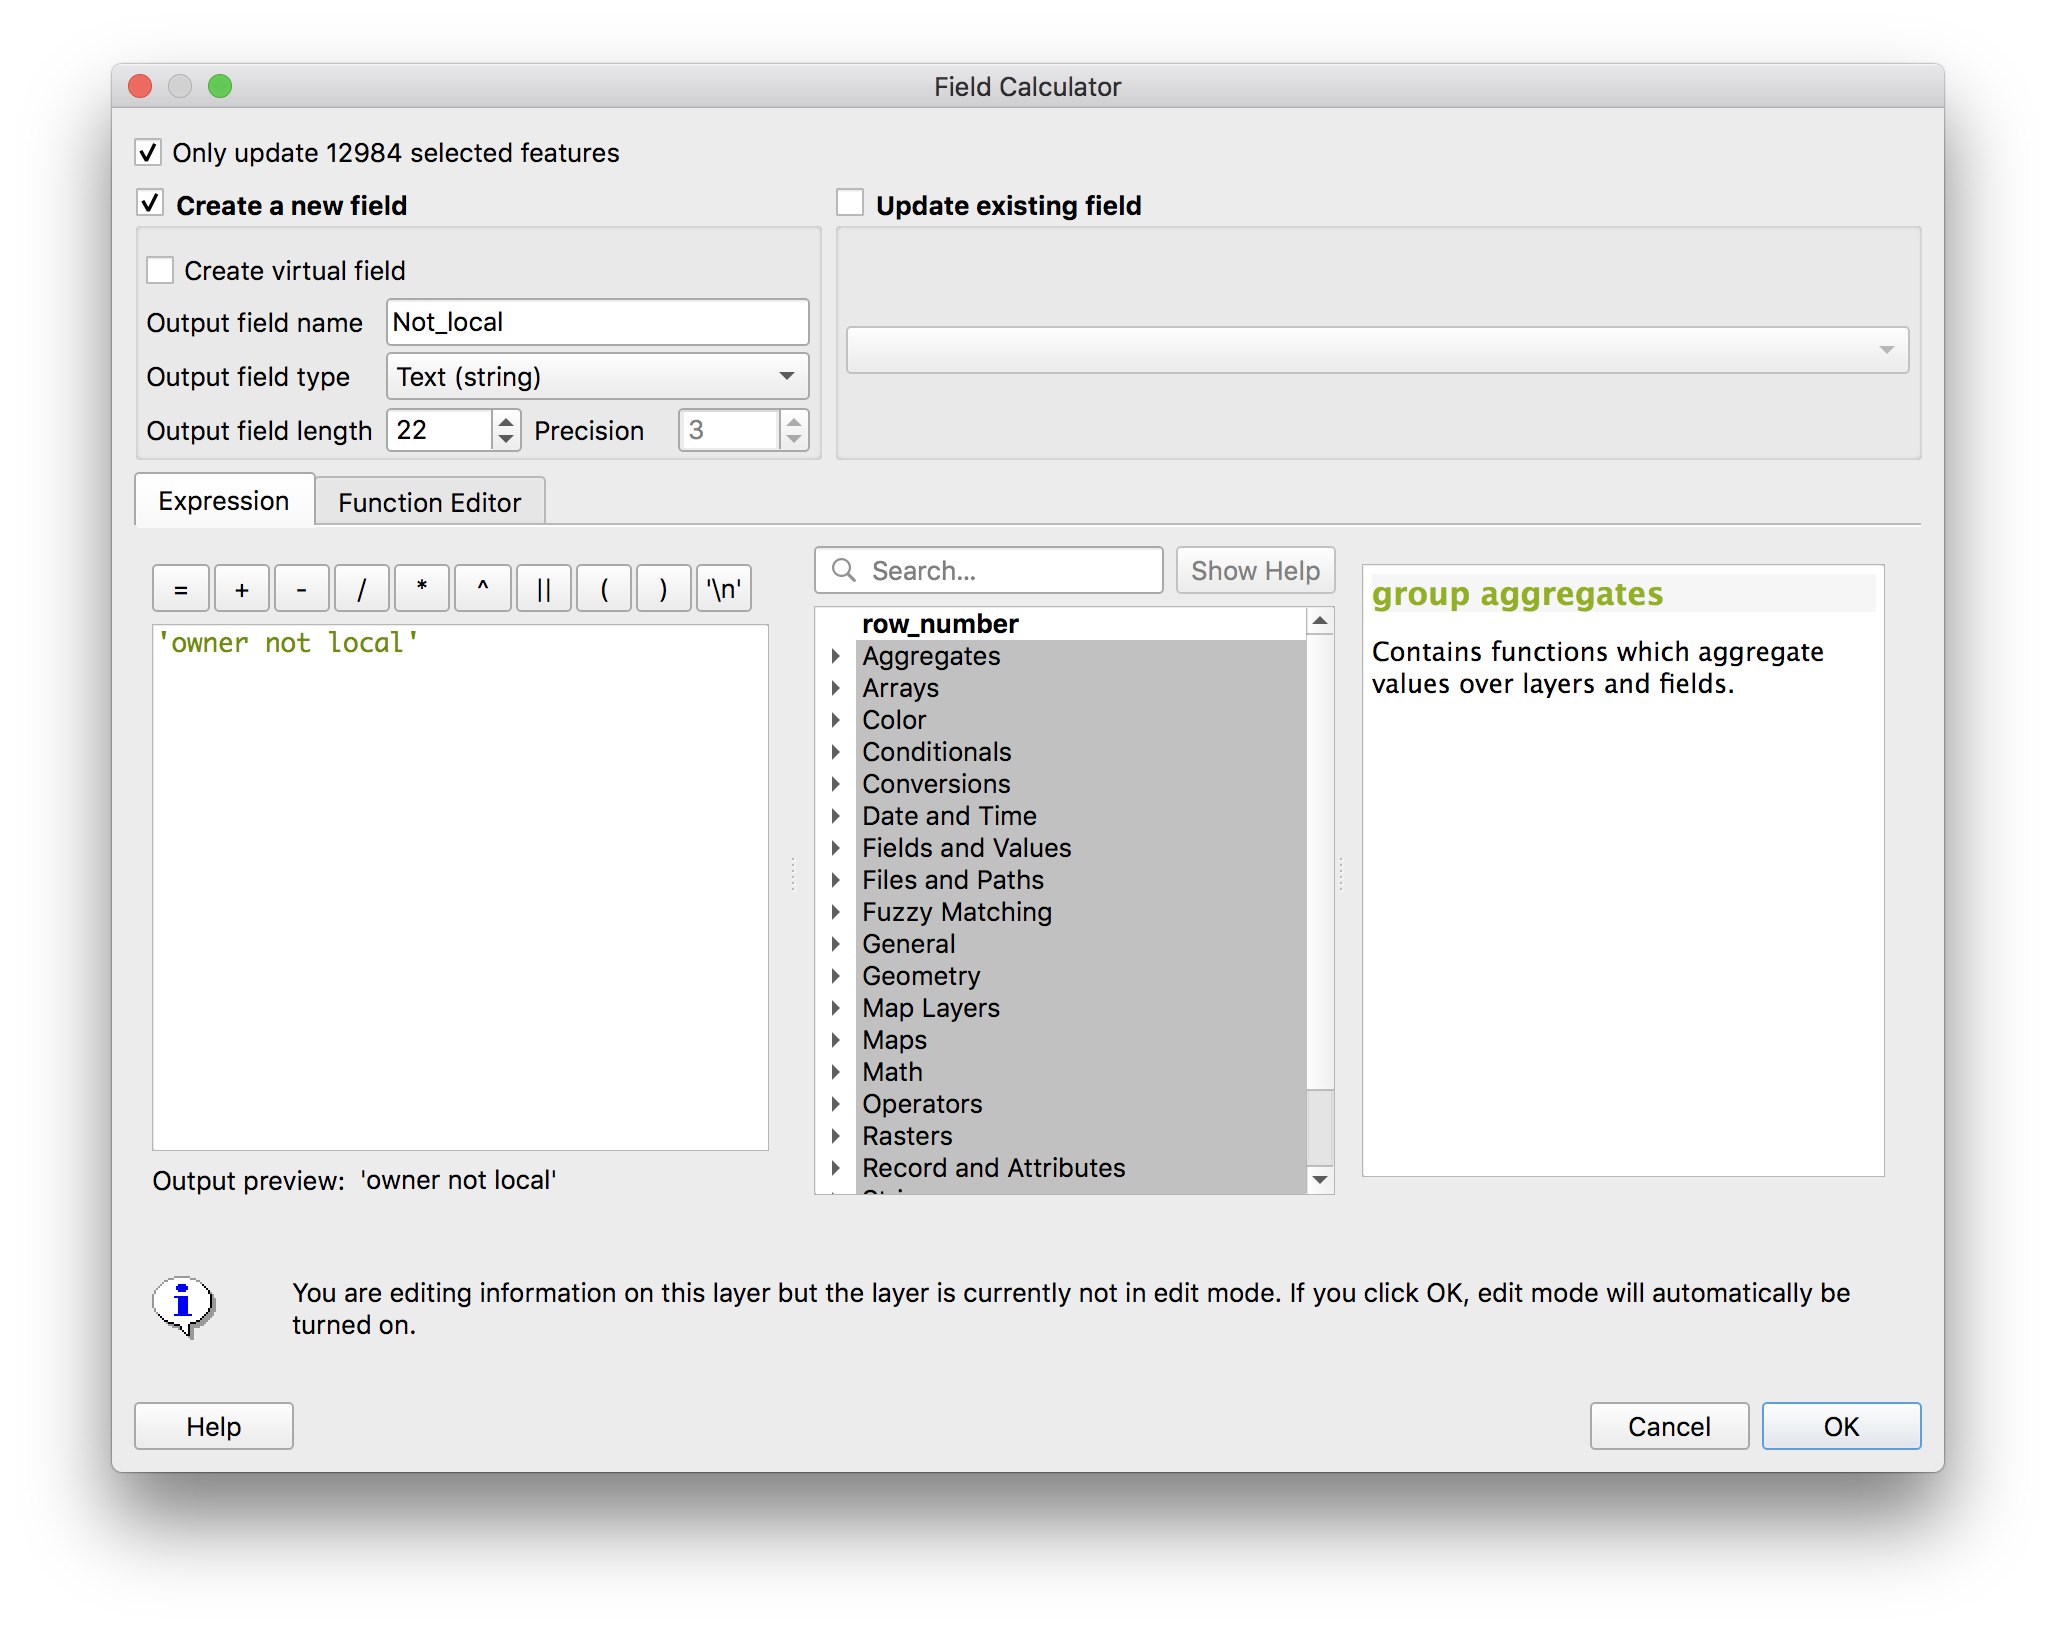
Once you have the Field calculator open make the following selections to create a new field (column) which indicates that the owner’s address is not in newark. This column will be called Not_local it will be of the Text (string) type we will make it 22 characters long and fill it manually with the value owner not local by typing owner not local in the expression window. Then click OK
 Creating a new field turned on Editing mode automatically. To save our changes click the
 Save edits button (floppy disk with a pencil), then click the Toggle editing mode button (pencil icon) both of these buttons are at the top of the attribtue table window.
Click the pencil icon
SAVE your project.
Data queries by location
Now lets use some of the spatial capabilities of GIS to find out: how many tax parcels have owners with non-Newark addresses in the West Ward of Newark?
First change the layer order to bring the wards layer to the top. Zoom out to see all of Newark by right clicking on the wards layer and selecting Zoom to layer
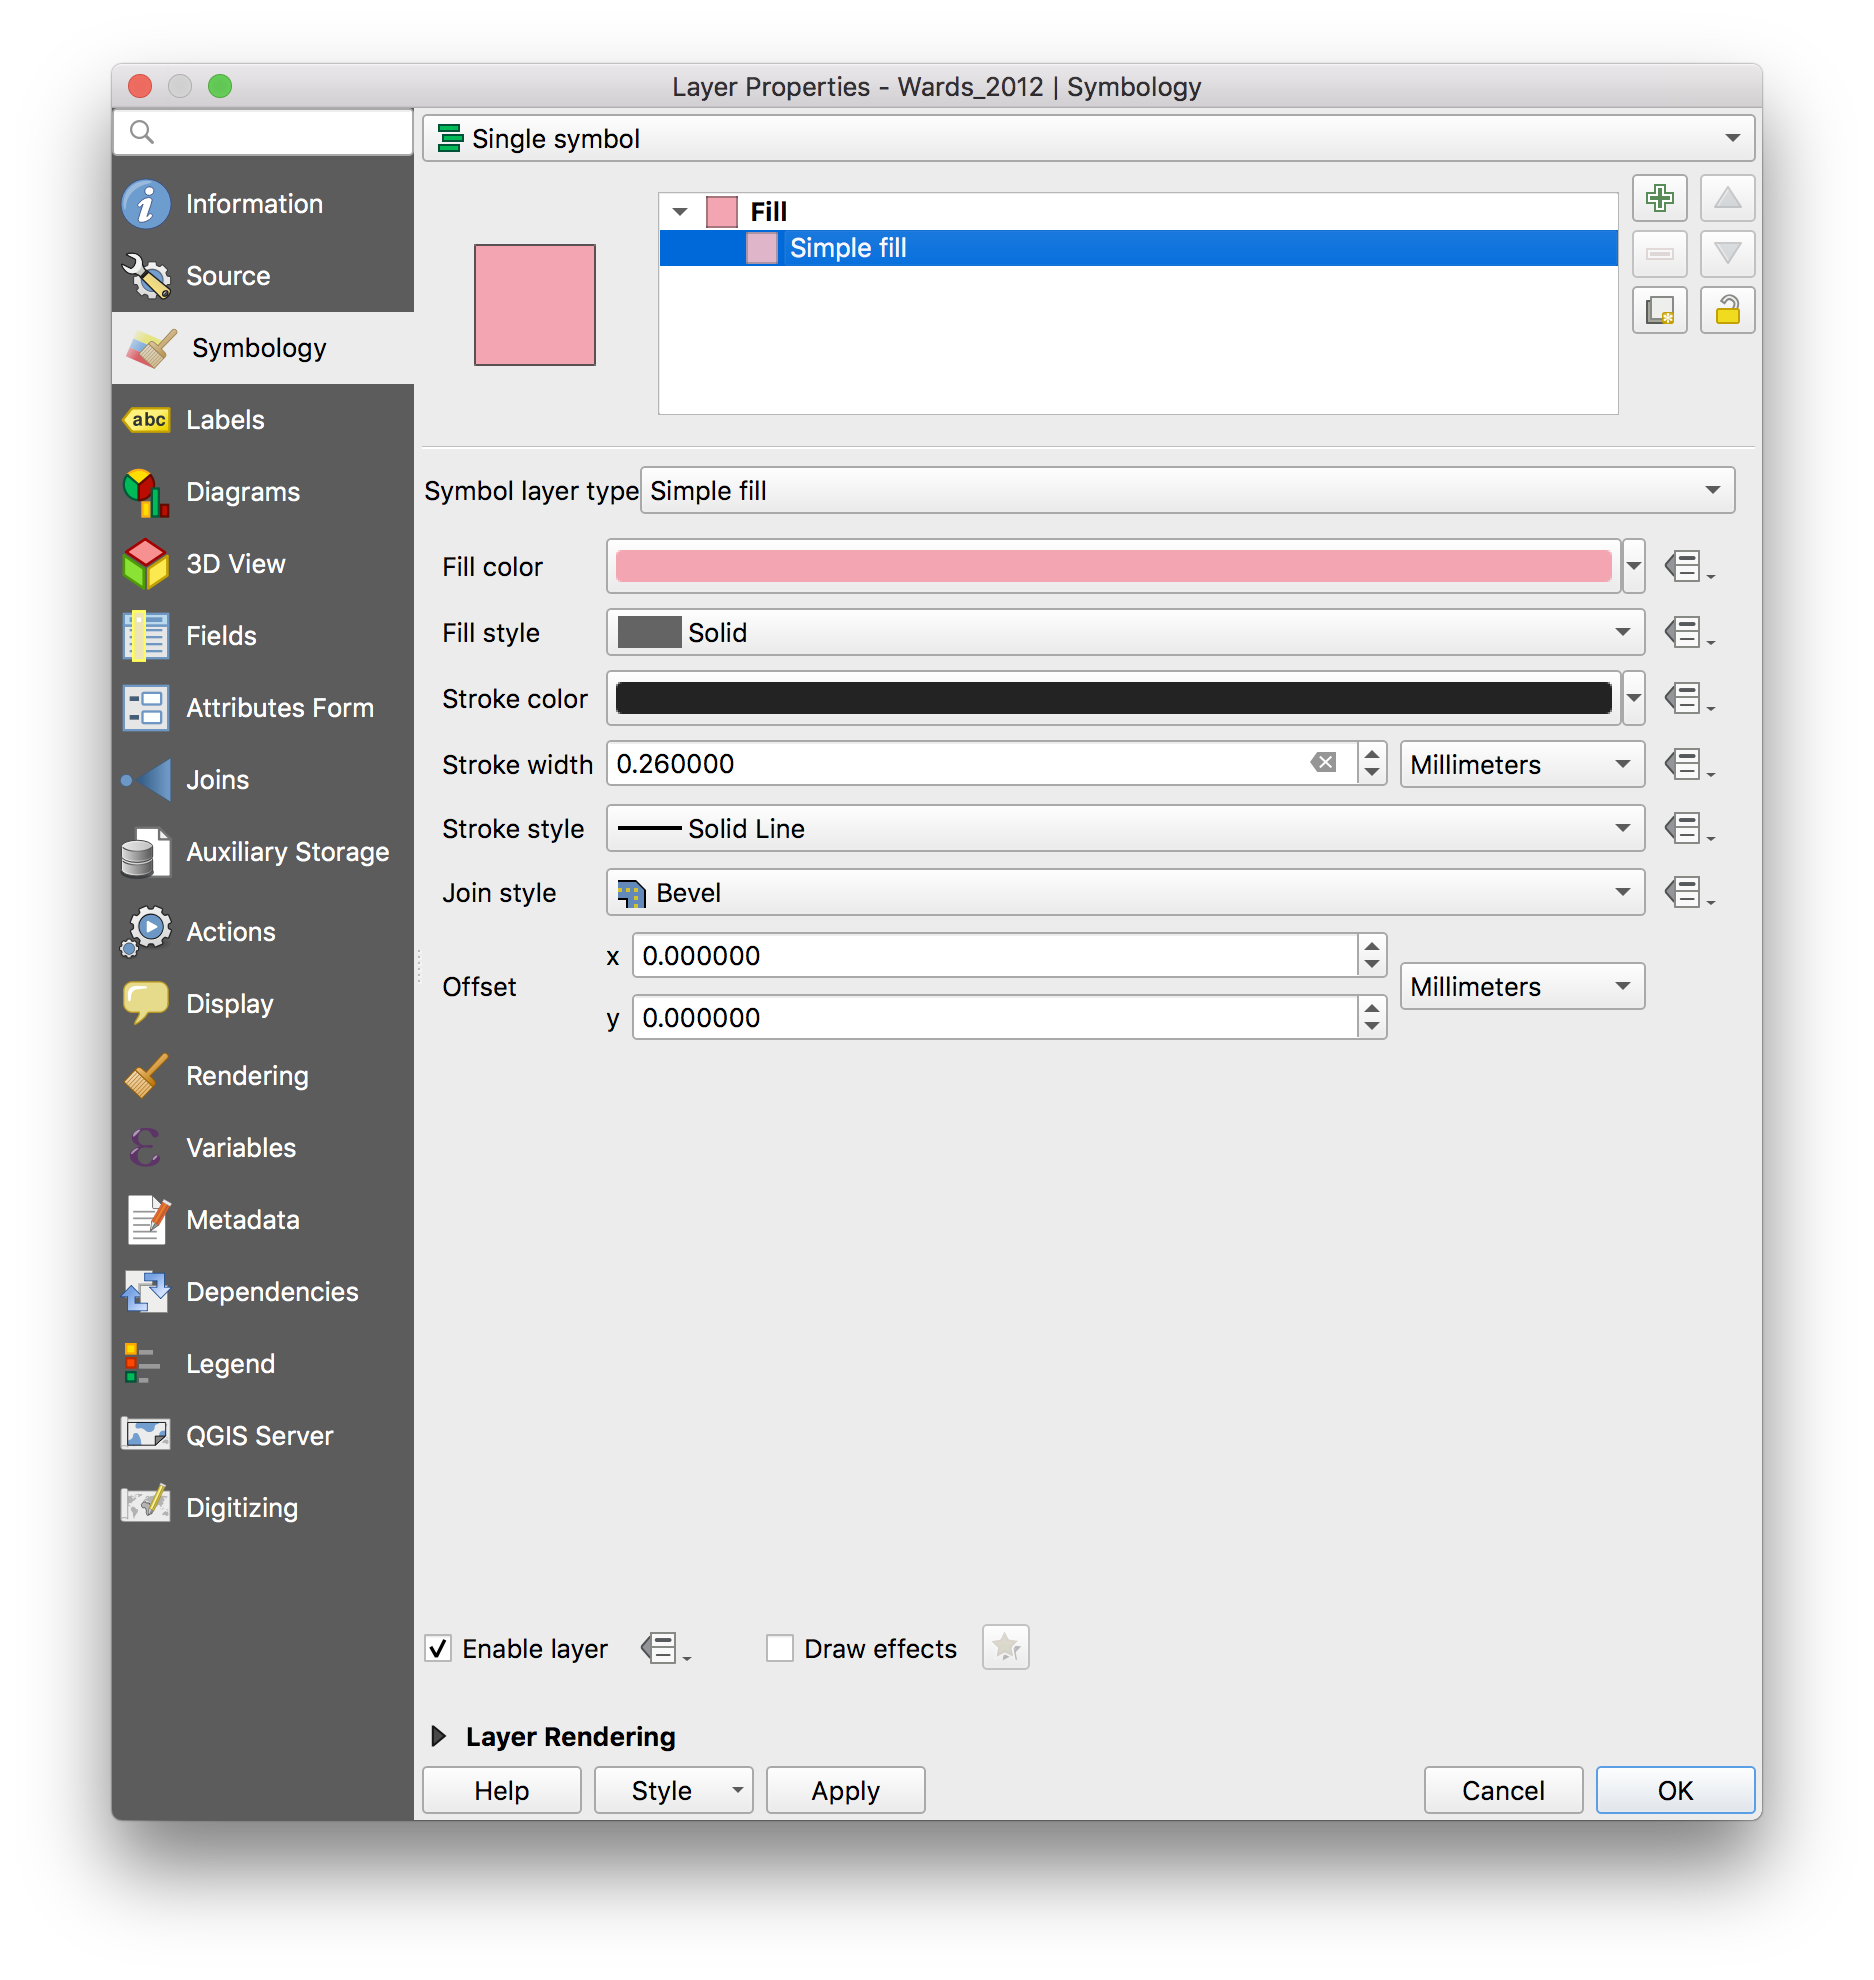
So that we can see what is below the wards in the map, we will change the symbology of the wards layer. Right click again on the wards layer, then select Layer properties. Select the Symbology menu. Adjust the fill and stroke options to set a transparent fill and a bold stroke in a noticeable color.
Manually select WEST Ward using the Select features tool.
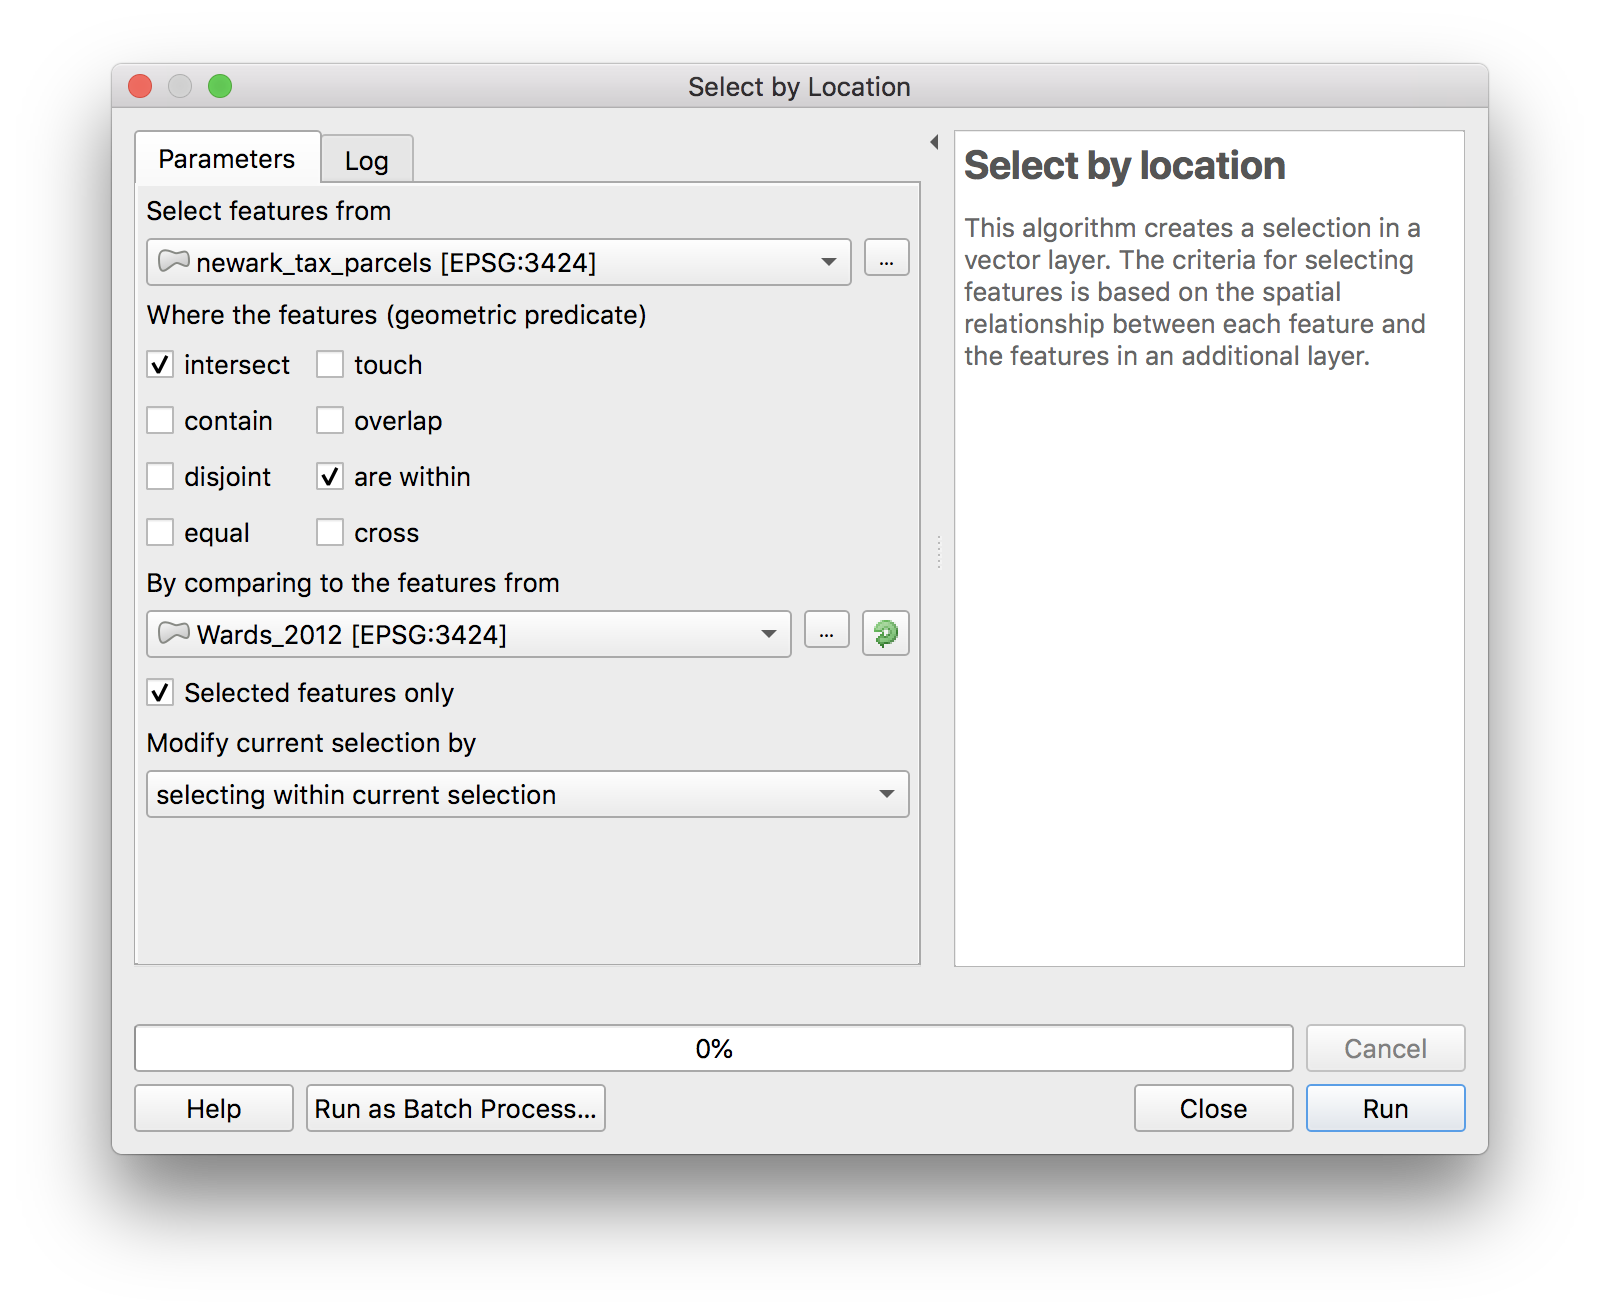
Now navigate to the Vector menu on the top bar and then Research tools>Select by location and make the following selections exactly.
Zoom in to see that only parcels within the West Ward remain selected.
 How many parcels in the West Ward have owners with a non-Newark address? Note this answer you will be required to turn it in with your assignment.
On your own repeat the steps above but for North Ward. Note this answer you will be required to turn it in with your assignment.
SAVE your project.
Creating a point layer from lat/lon
Next we will add a new dataset containing the latitude and longitude coordinates for vacant parcels identified by a survey of Newark in 2017. We will investigate which vacant properties have non local owners.
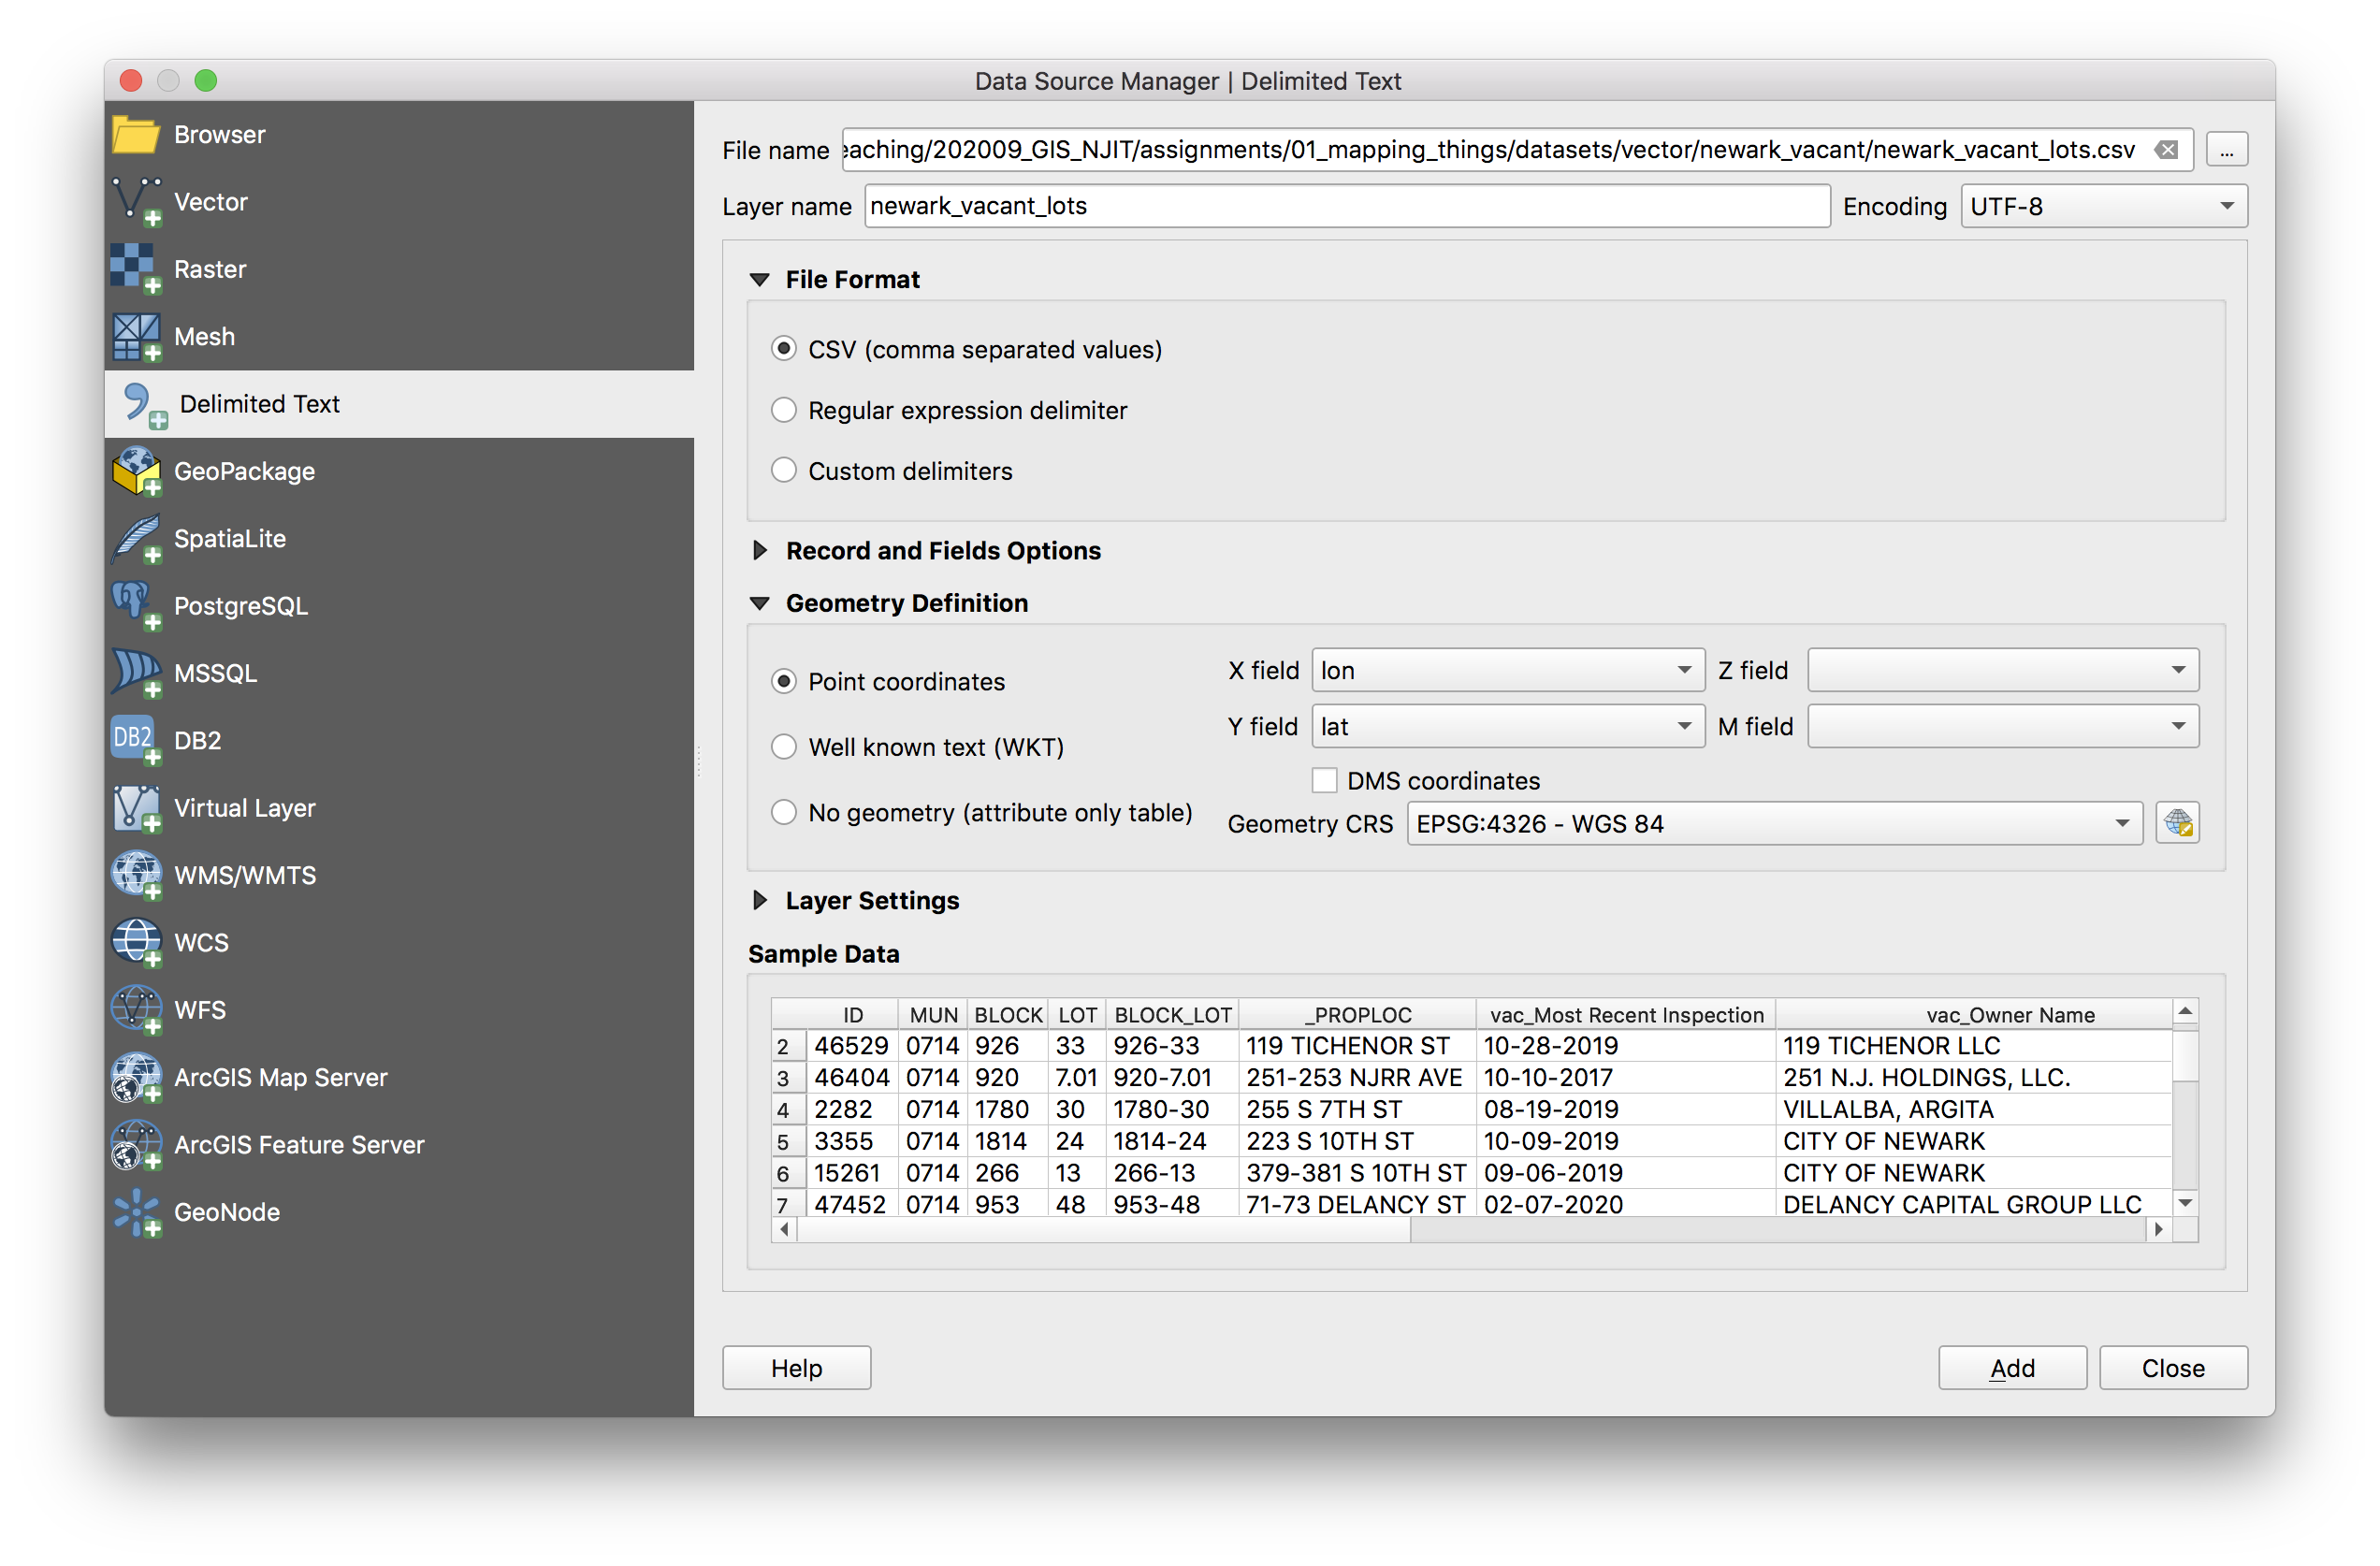
Select Layer>Add Layer>Add delimited text layer options. Then in the dialog window that opens make exactly these selections:
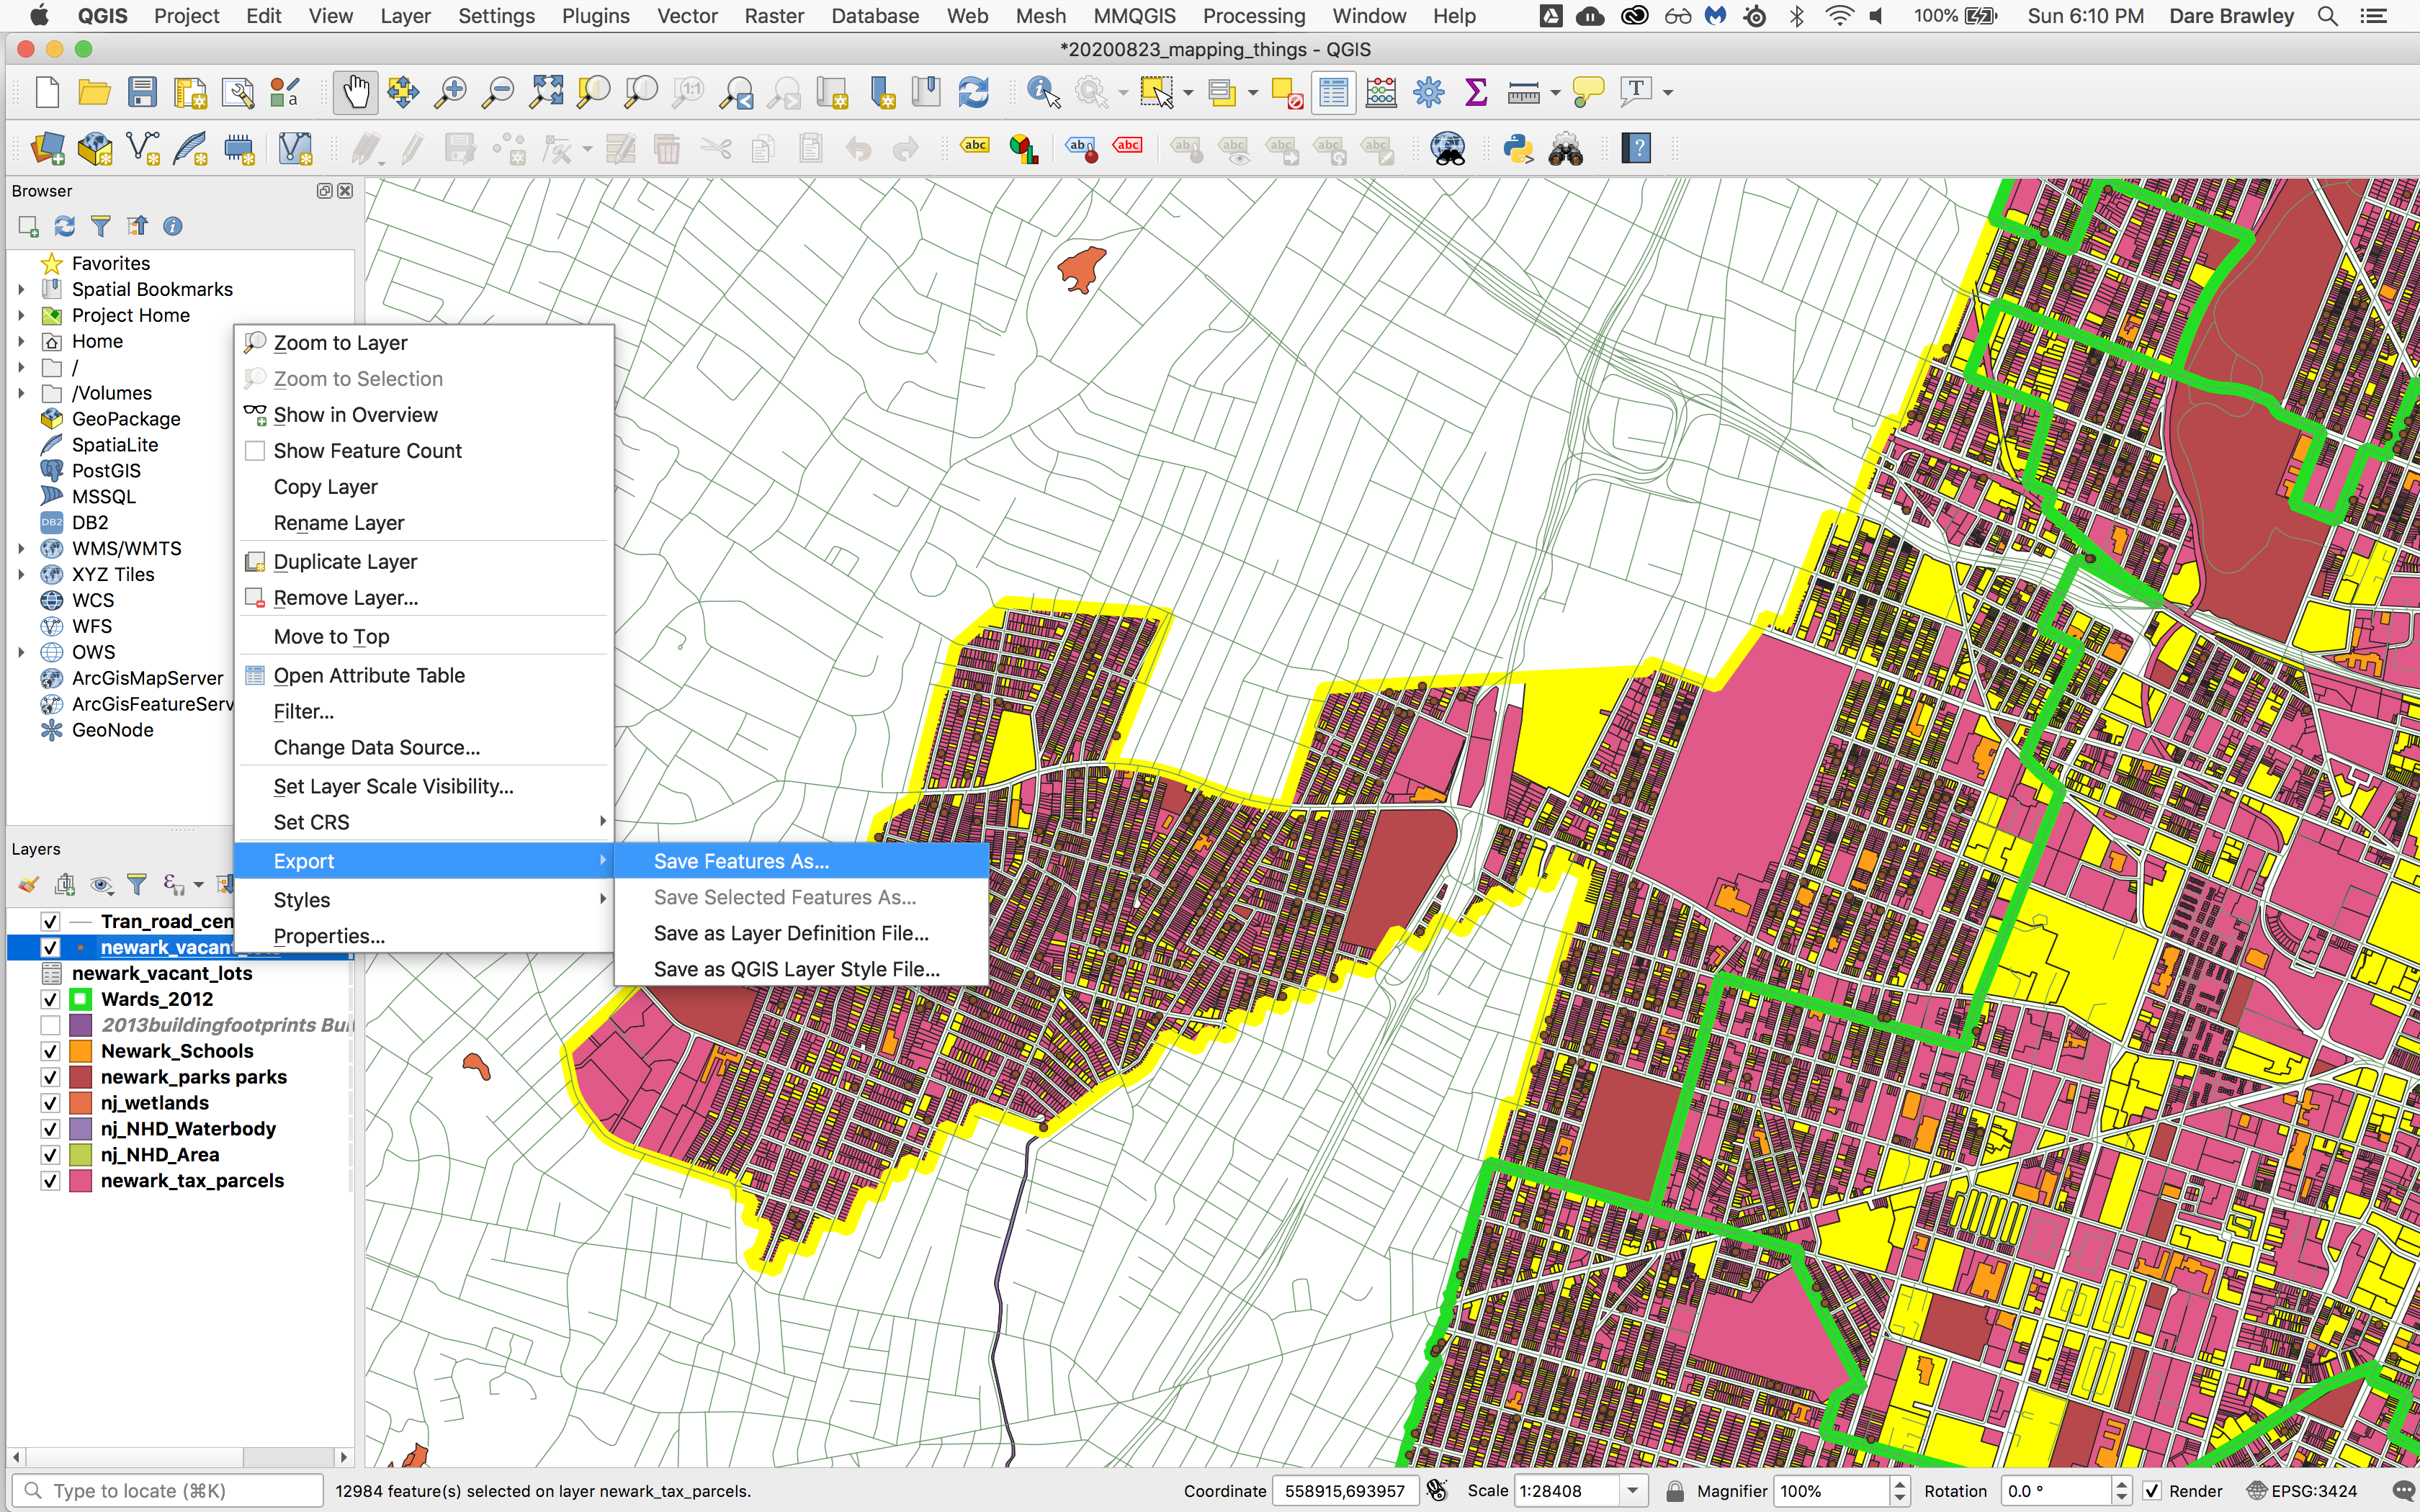
To save these points as a new dataset right click on the points layer that was created and select Export>Save features as
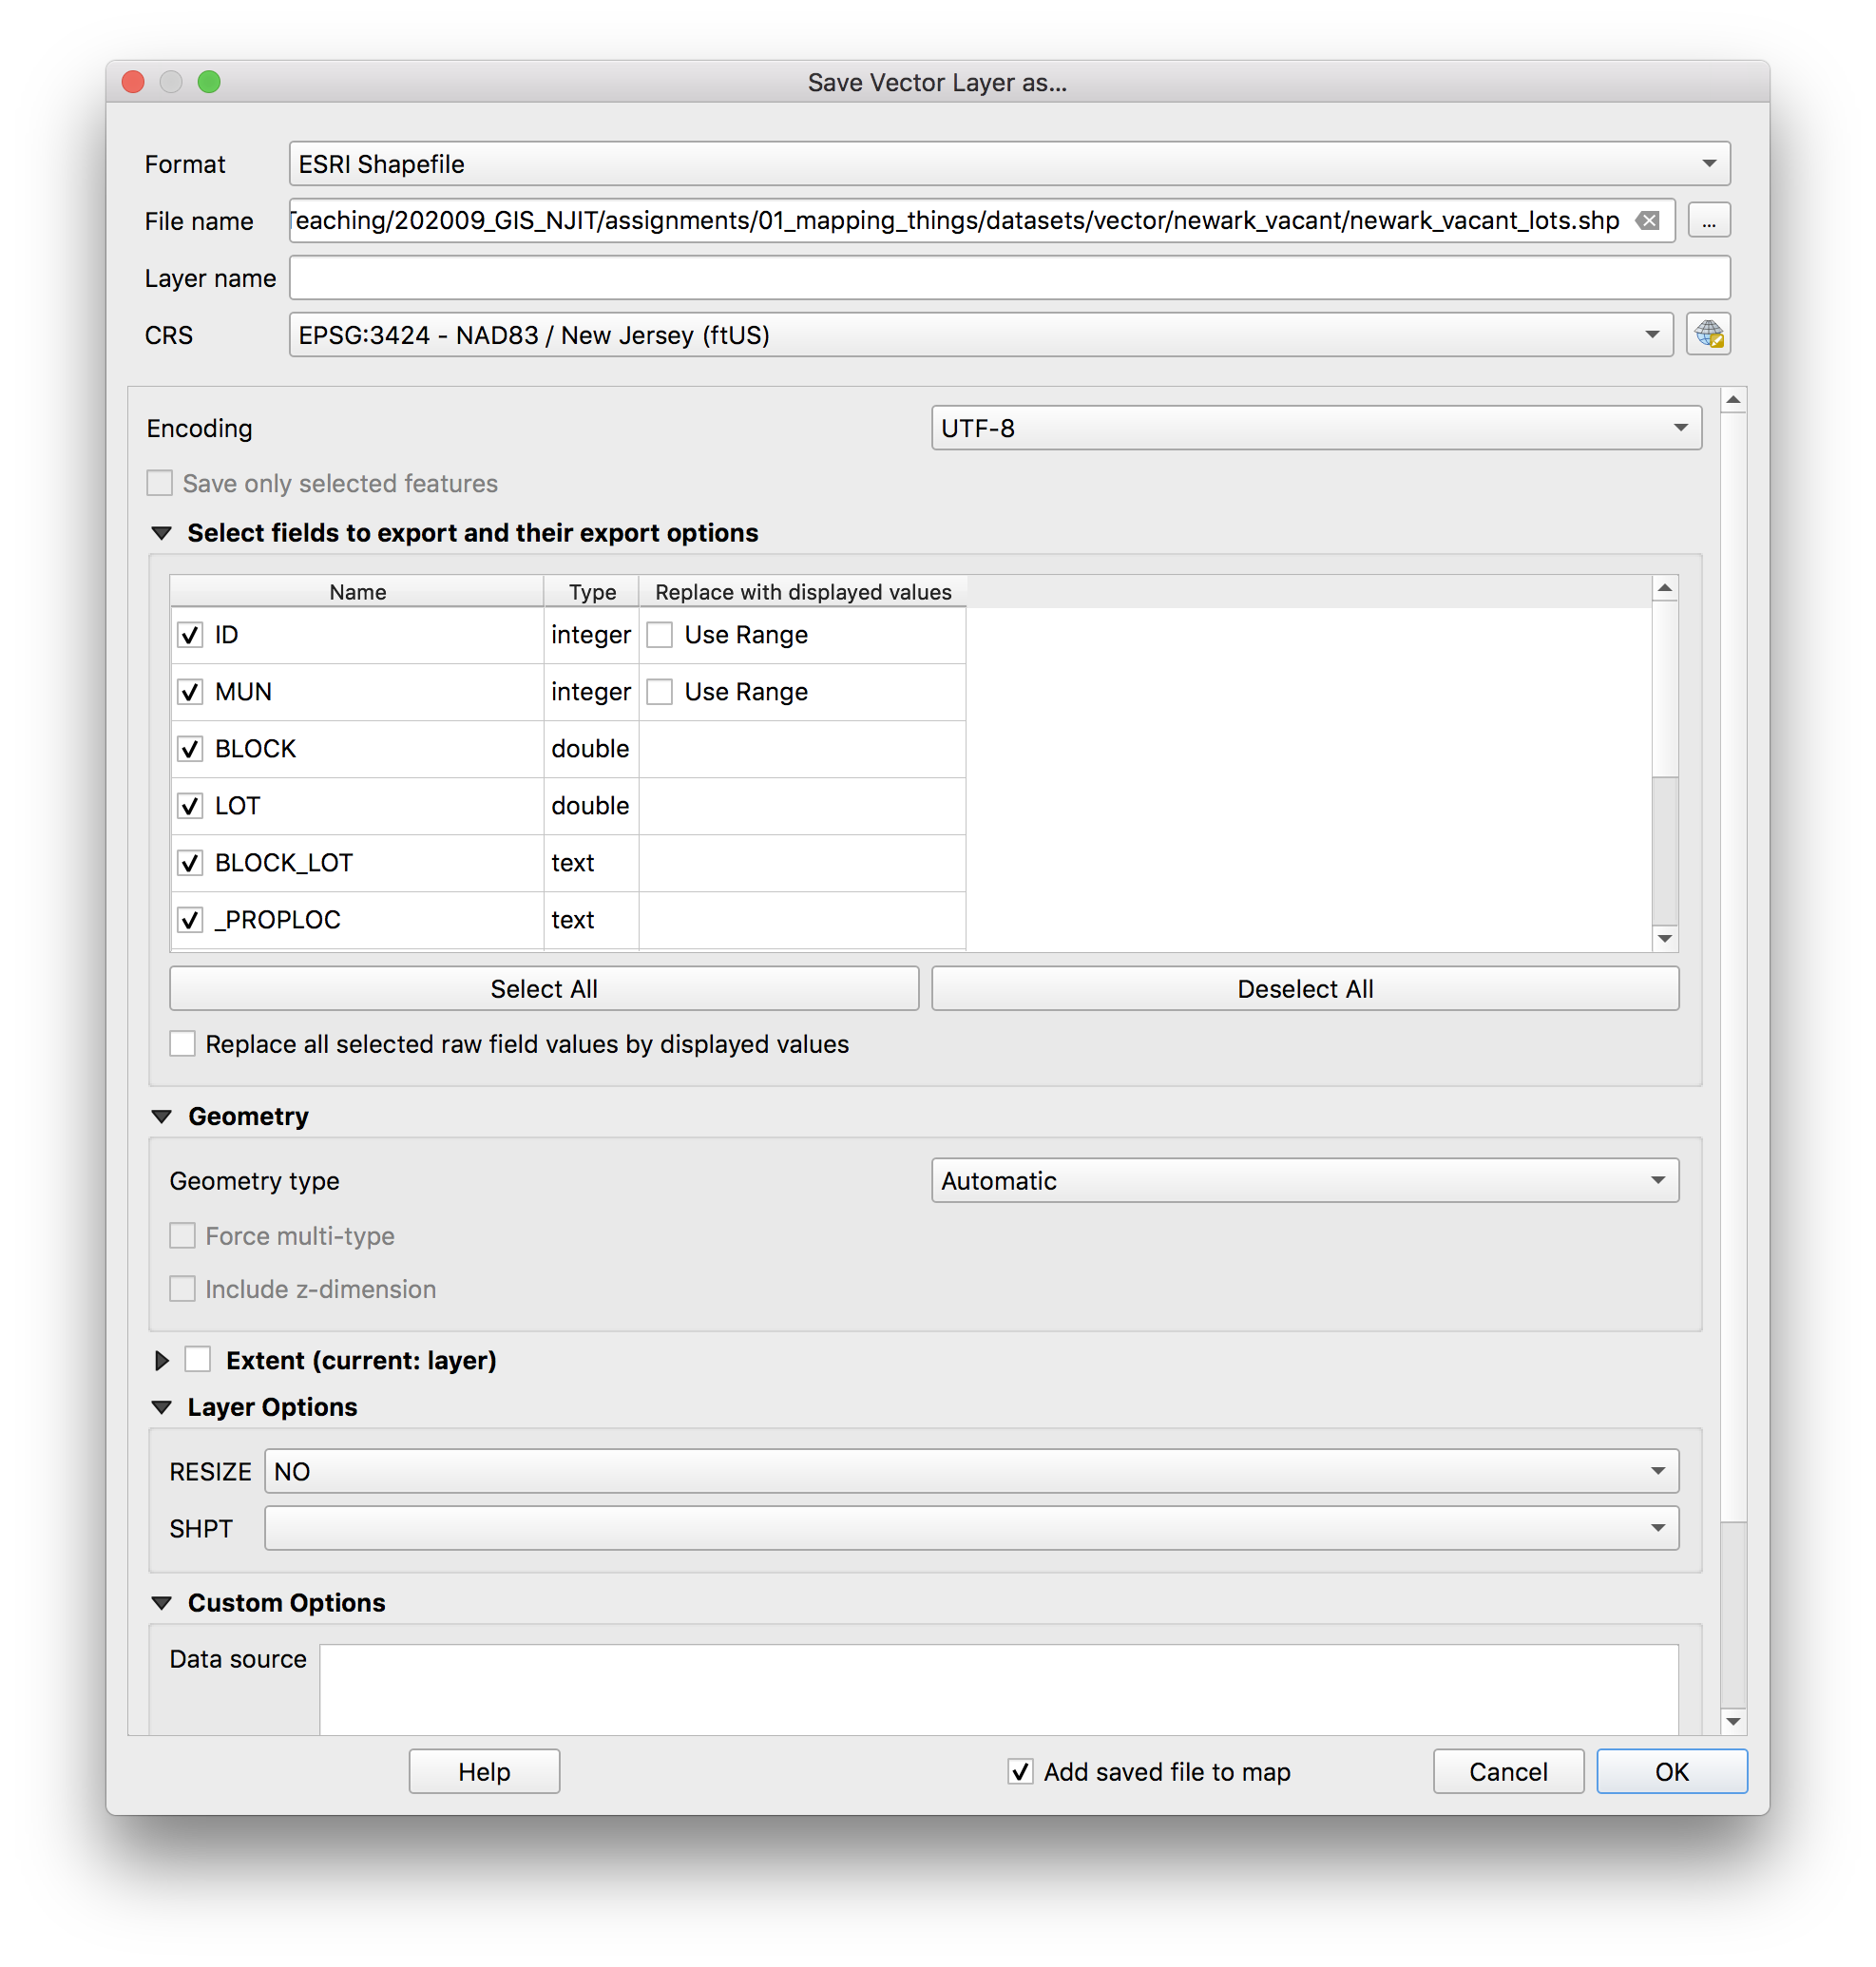
Make exactly these selection in the Save vector layer as... menu.
Remove temporary vacant lots dataset: right click on layer name and select Remove layer
Clear any/all selections you currently have using the clear selections tool.
SAVE your project.
Queries part 2: How many vacant properties are on tax parcels with a non-newark owner listed?
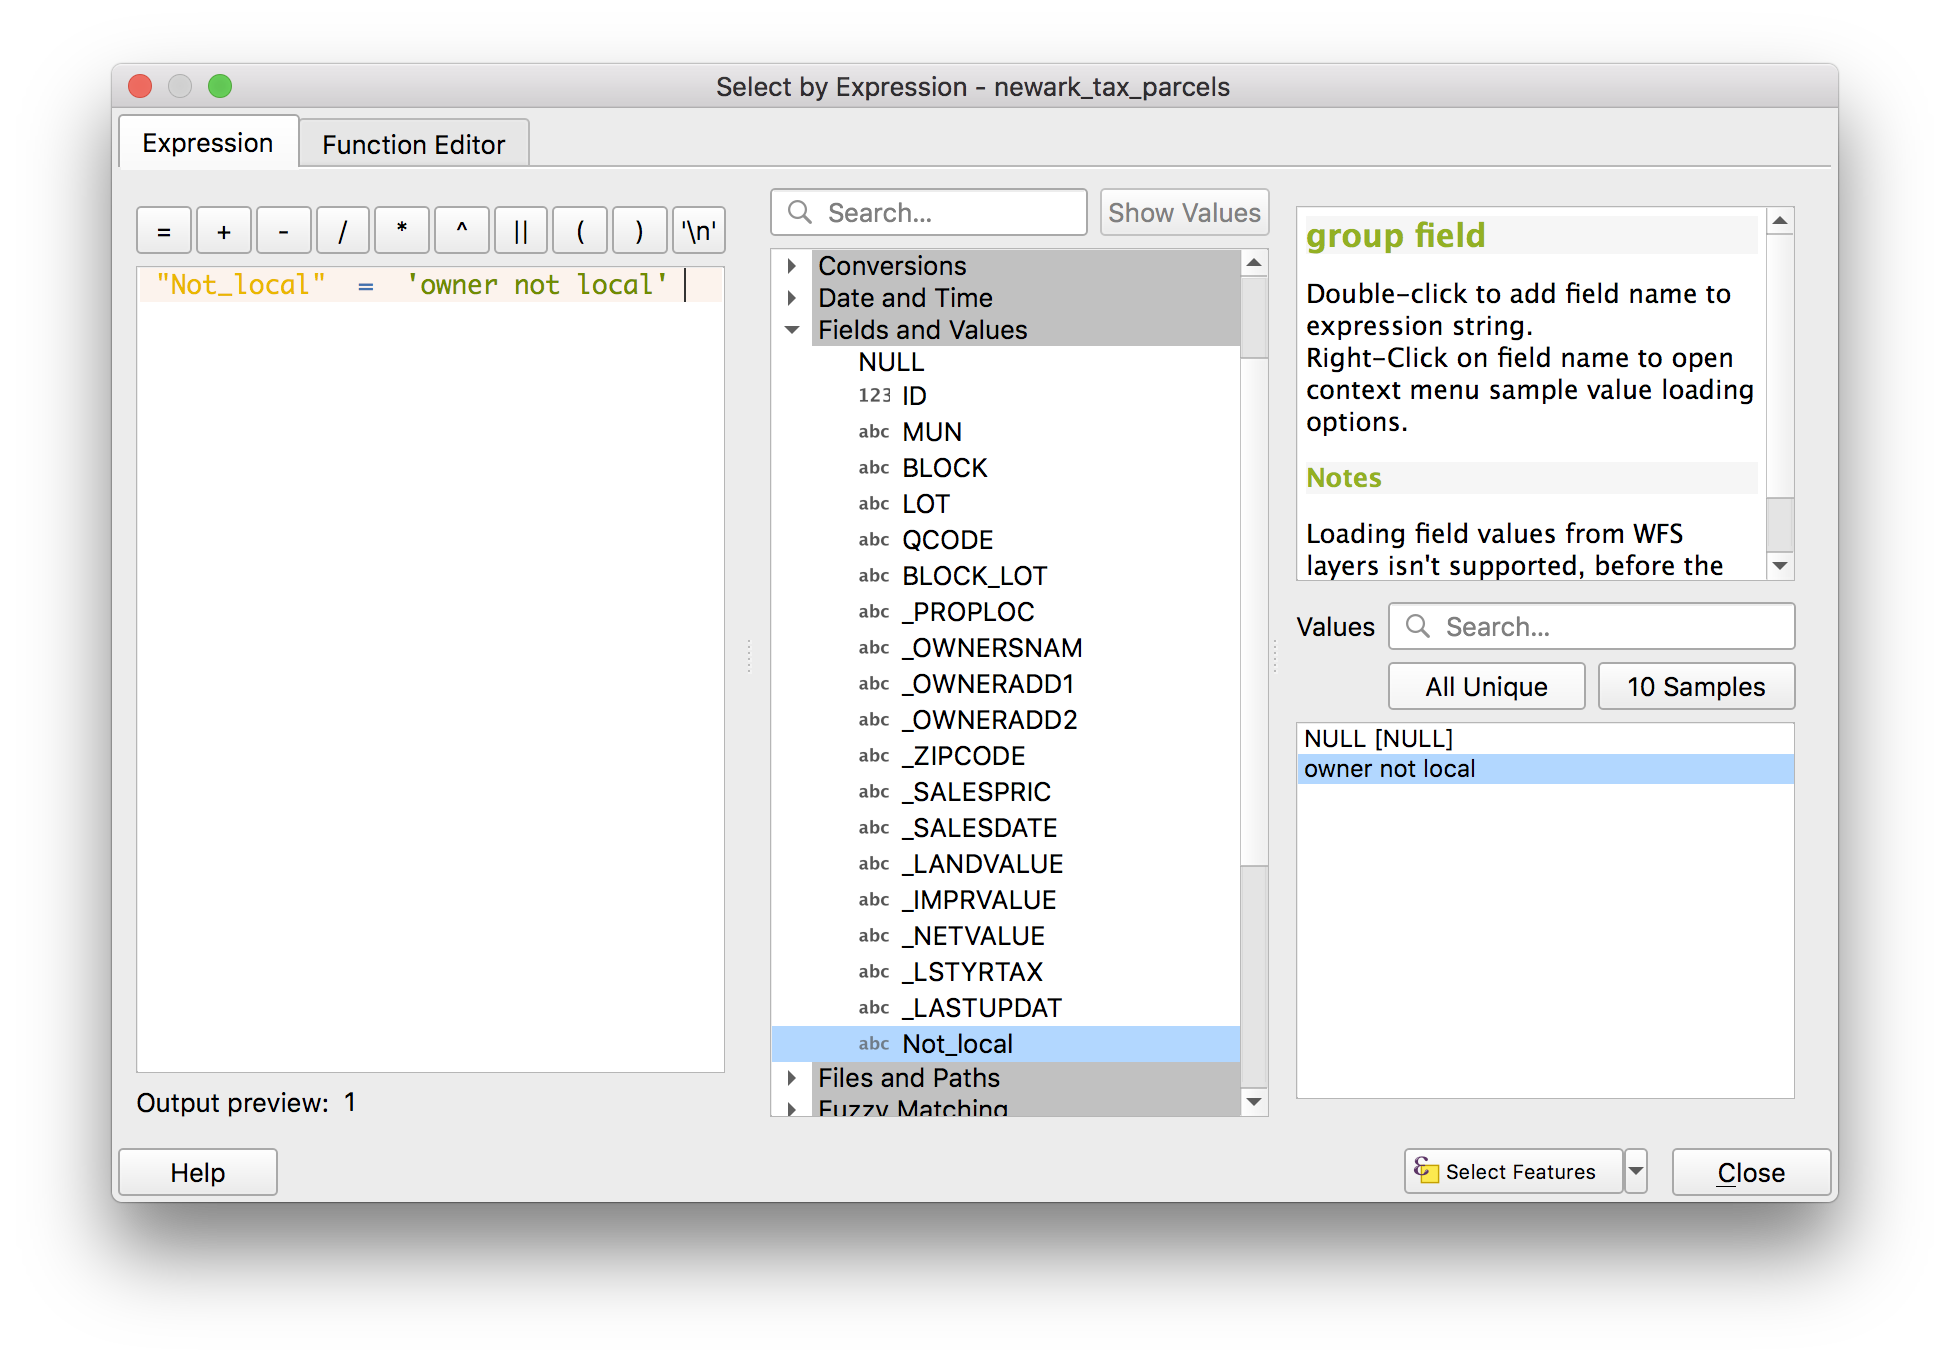
Open the attribute table for the Newark parcels layer. We will use the Not_local column we created before to construct a quick attribute query.
Click the Select by expression tool (looks like a yellow square with a purple E on it). Expand the fields and values options, double click on Not_local and it will appear in the expression window. Then double click All unique to get all of the unique values for the field in the expression window. Double click owner not local that appears. Click select features. Close the attribute table.
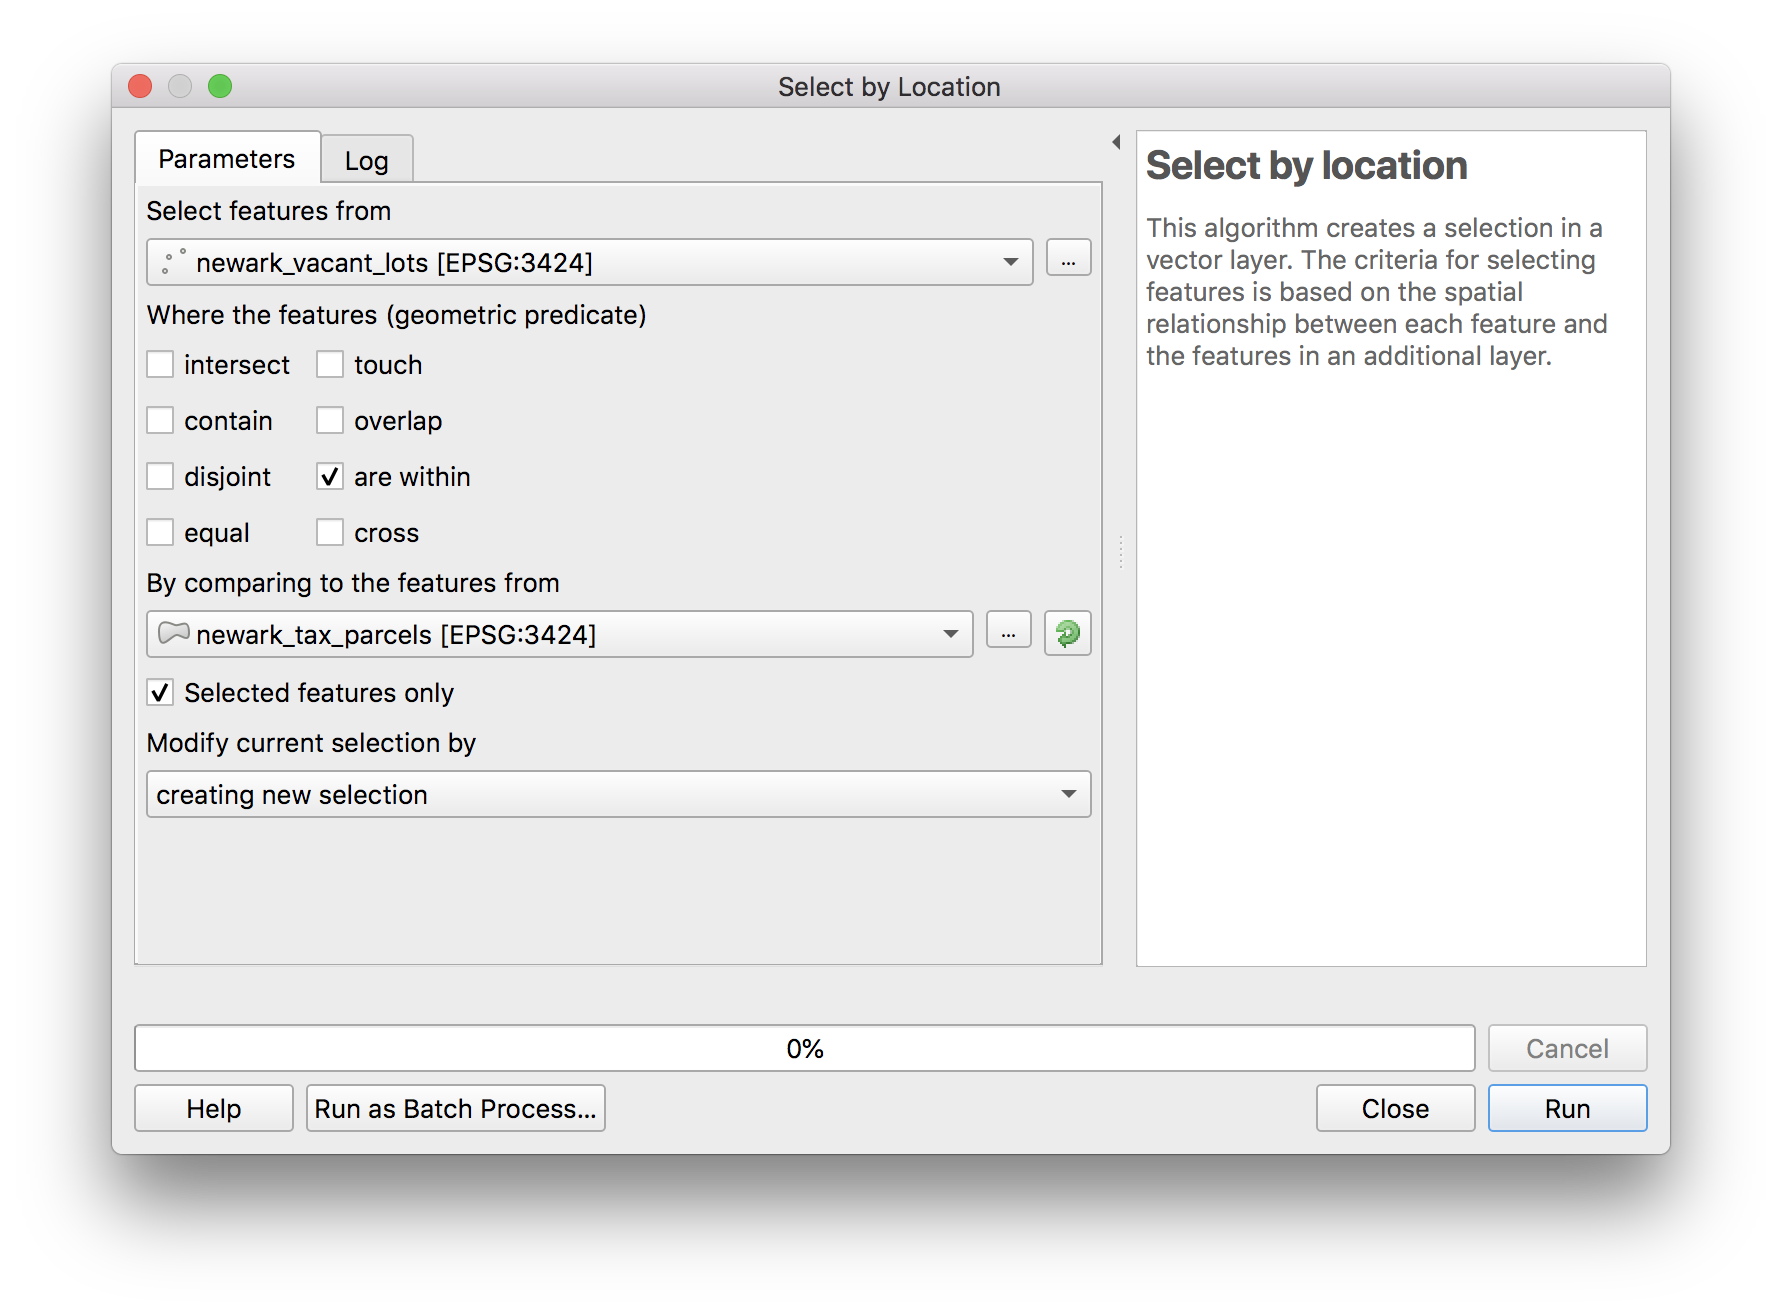
 Next we will select the vacant properties that fall within these tax parcels using the select by location tool. Navigate to
 Vector>Research tools>Select by location. Select exactly these options from the menu
How many vacant properties have listed owners whose address it outside Newark? Note this answer you will be required to turn it in with your assignment. Bonus question: what percentage of the total vacant parcels included in the survey is this? Note this answer you will get extra credit if you supply the correct answer.
SAVE your project.
Part 02: working with coordinate reference systems
There are multiple different ways that coordinate reference systms impact a project in QGIS.
First it is important to understand that both datasets (layers) and the map canvas/QGIS project each have coordinate reference systems (and they may not always be the same).
To view the coordinate reference system (CRS) of a layer open the Layer properties menu for the layer, select the Information menu and inspect the CRS. All of the layers in this assignment should have EPSG:3424 - NAD83 / New Jersey (ftUS) - Projected. This is a projected coordinate reference system. It is name for the State Plane projection designed for New Jersey, it used the North American Datum (NAD) of 1983. The units are US Feet. The EPSG code is 3424. EPSG is an acronym for European Petroleum Survey Group, the organization that has helped to codify and catalog coordinate reference systmes from around the globe. It is important to notice and pay attention to which kinds of entities are well enough resourced to undertake such efforts…
To set the project CRS based on a layer right click on the layer name and then CRS>set project crs from layer.
To view the CRS of your map project select Project>Properties then select the CRS menu.
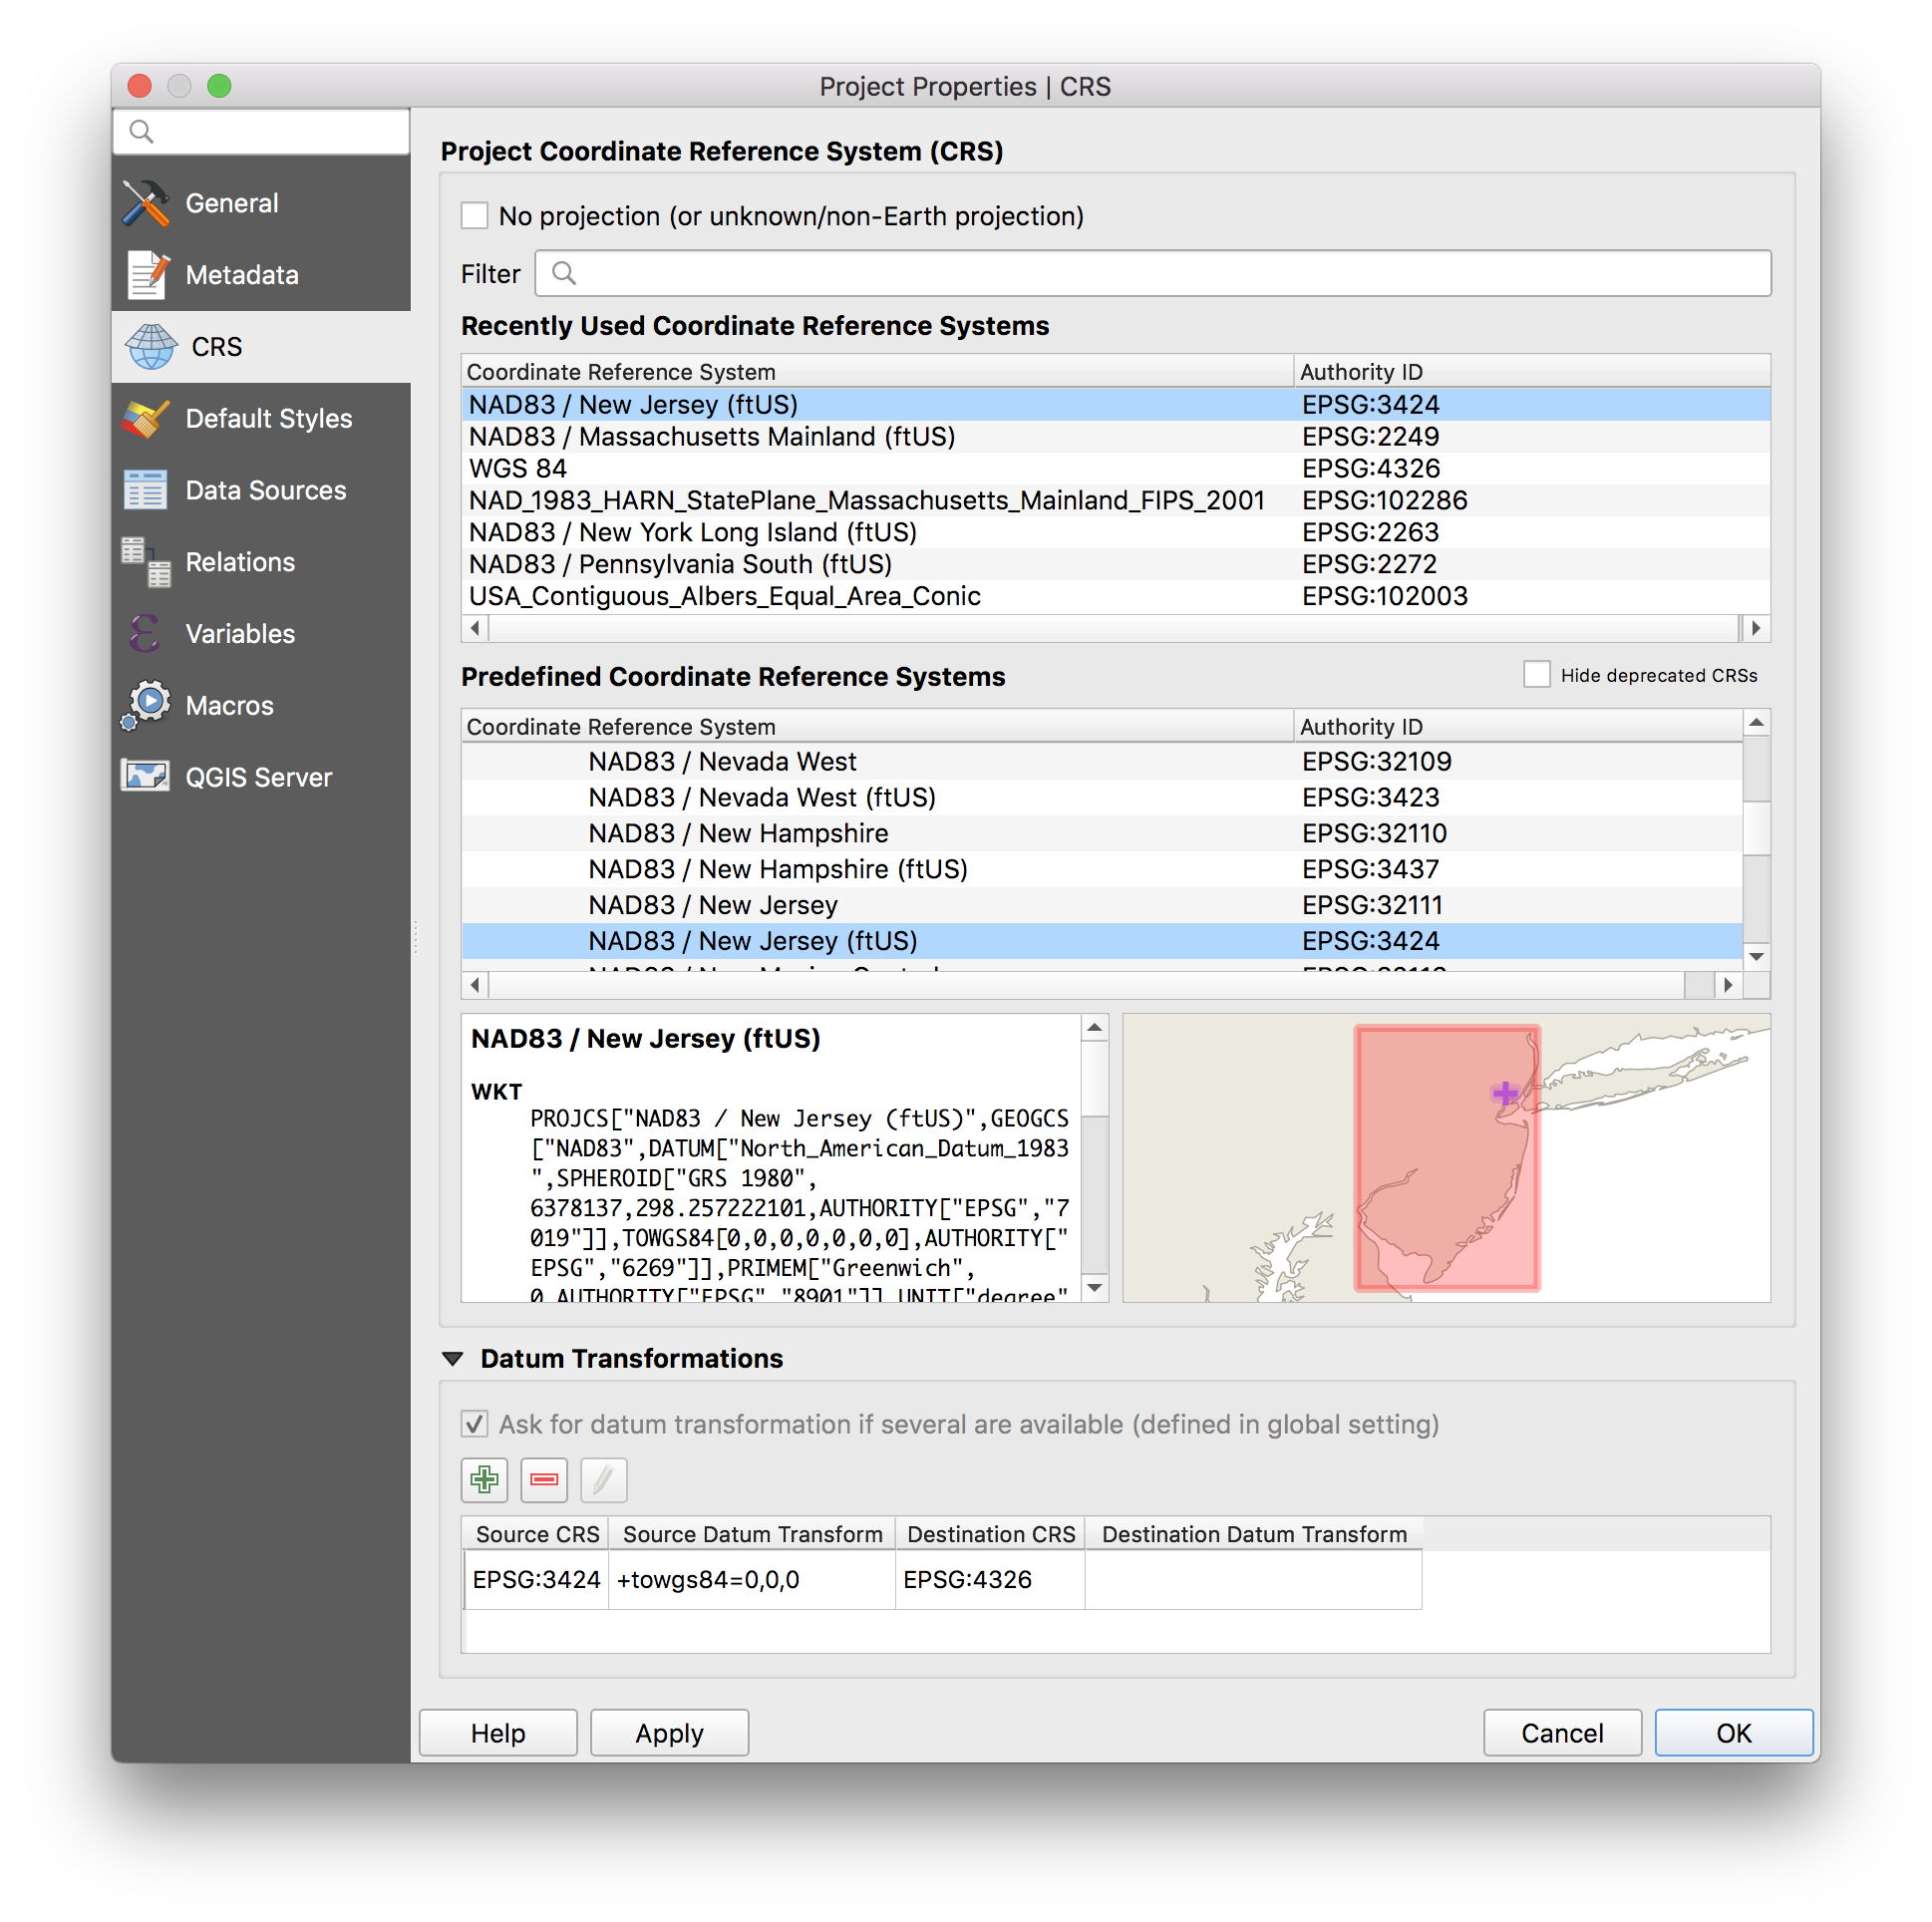
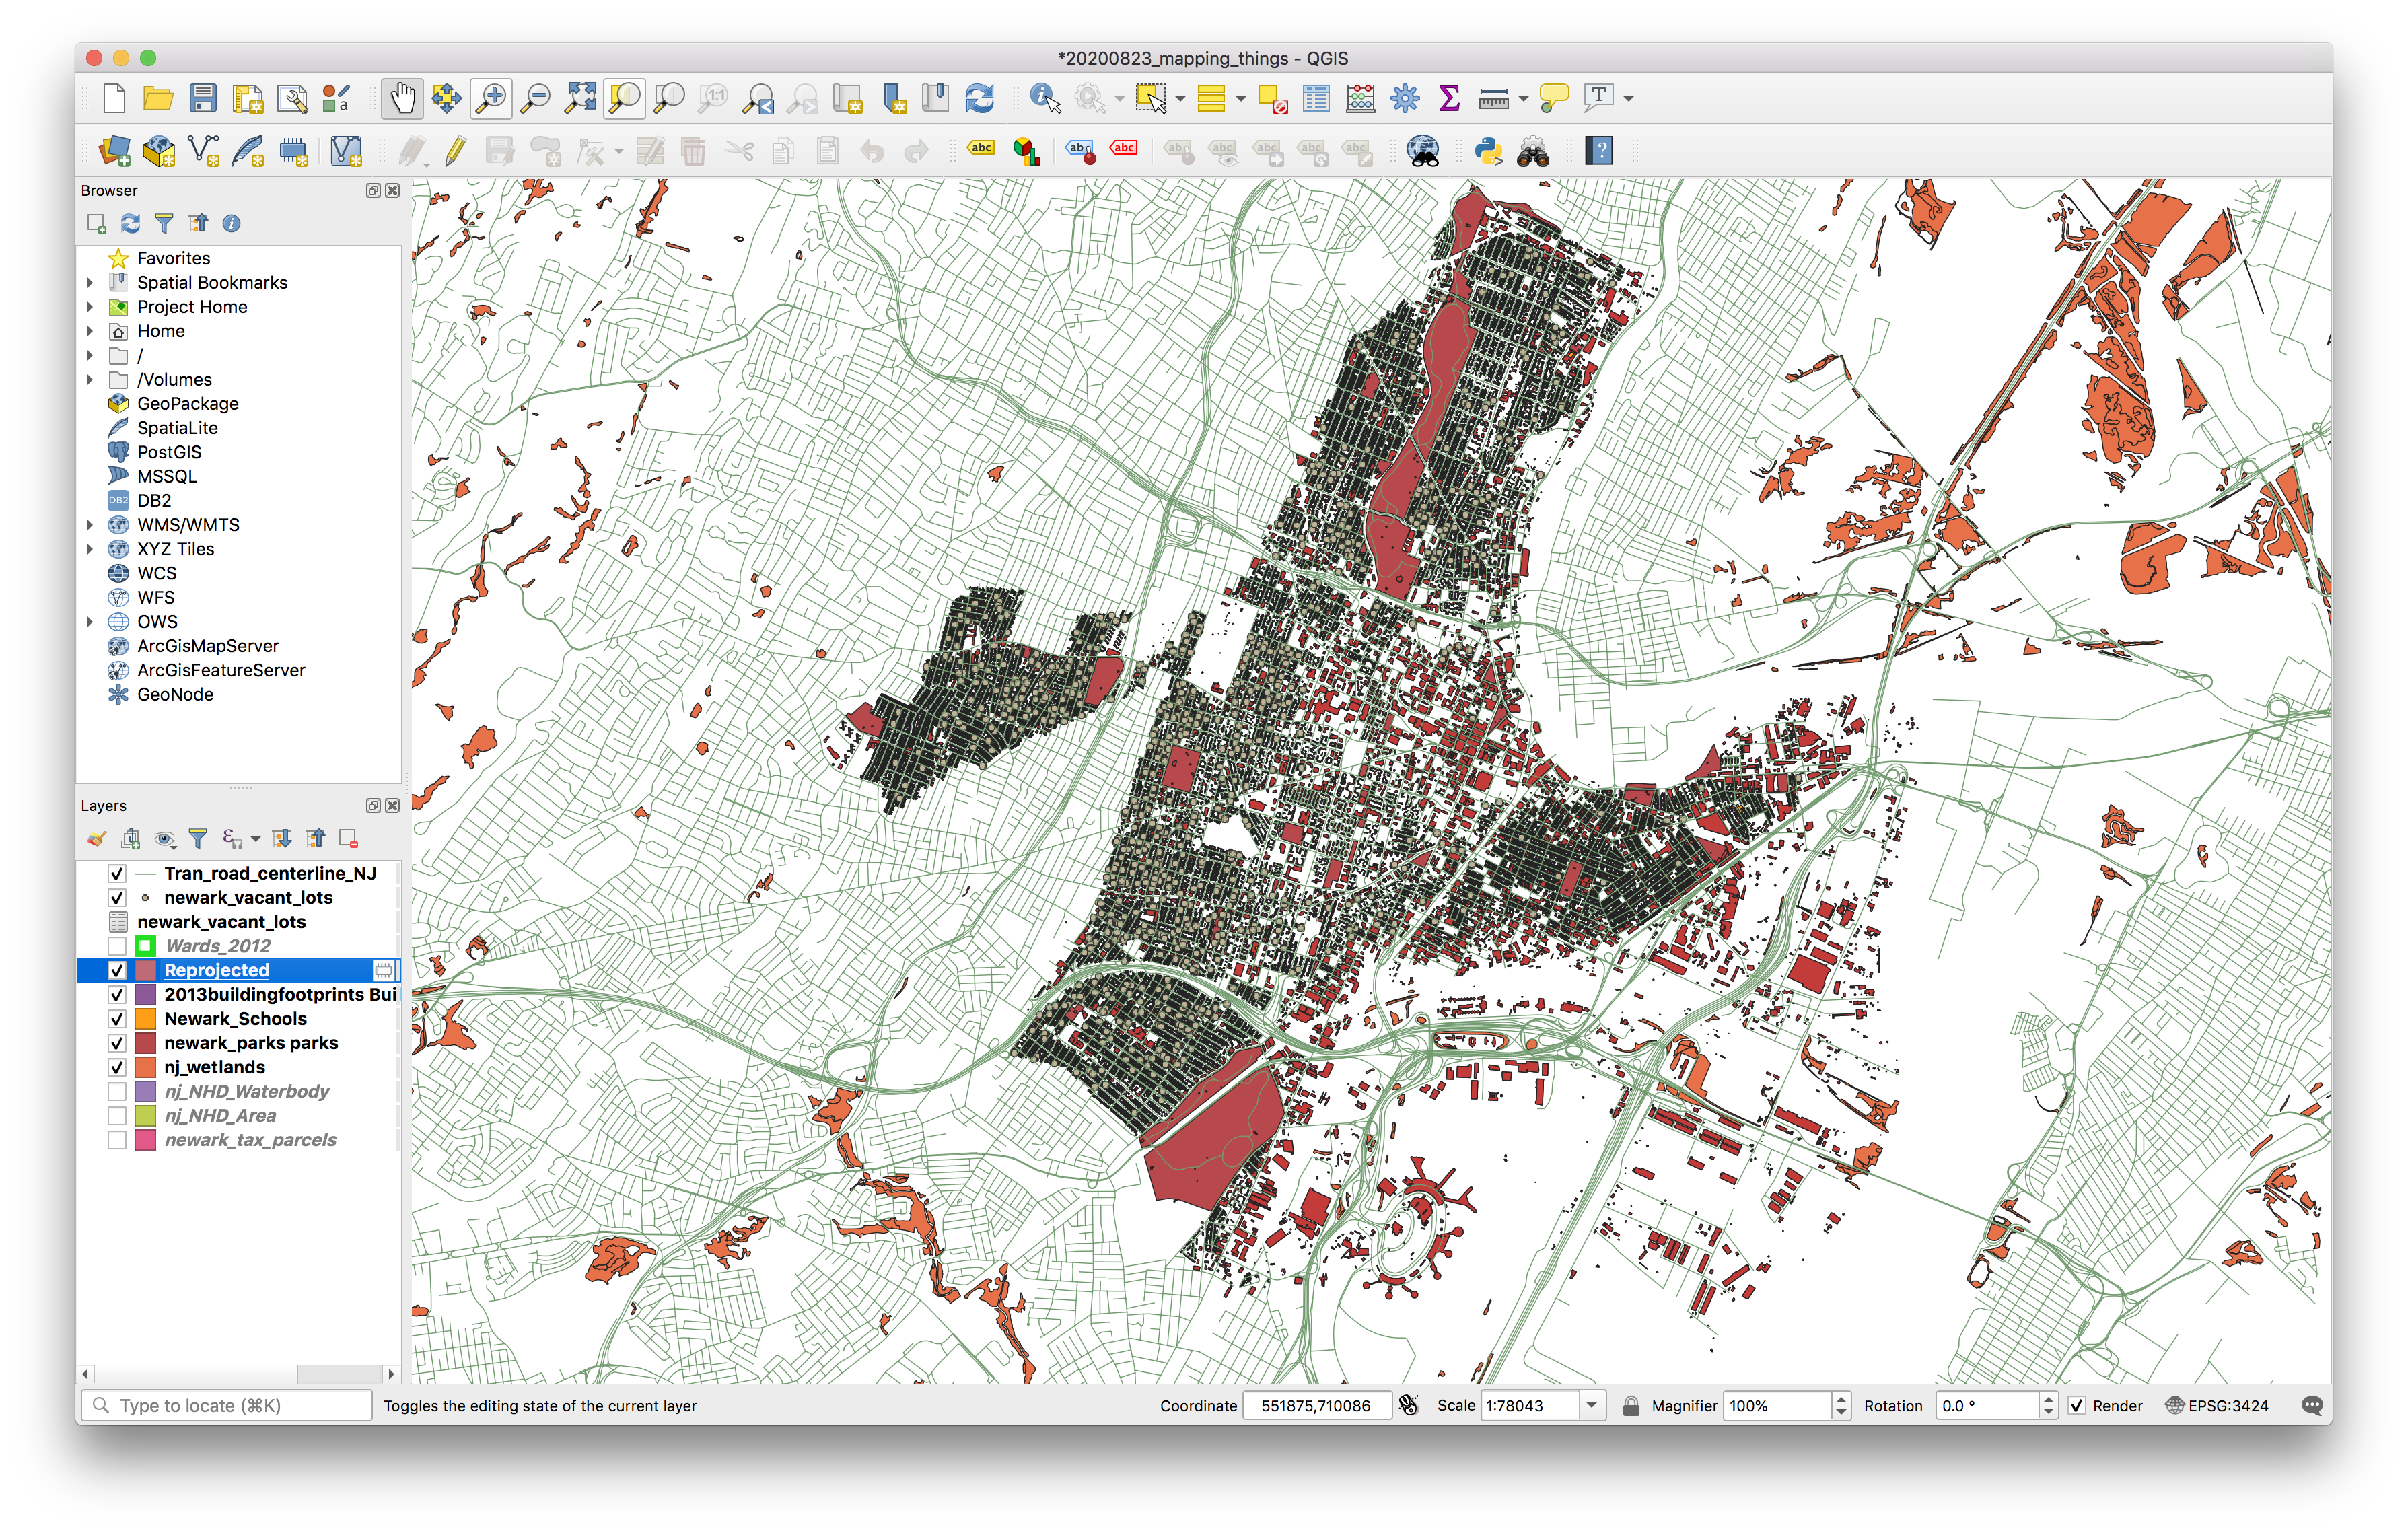
You can change this to be different from the CRS for the data layers in your project. See what happens. When you’re done return it to EPSG:3424.
Changing the CRS for the map project just changes how the data appears. It does not change anything about the underlying data.
To change the CRS for a layer we need to reproject it.
Select Vector>Data Management Tools>Reproject Layers. Make the following selections
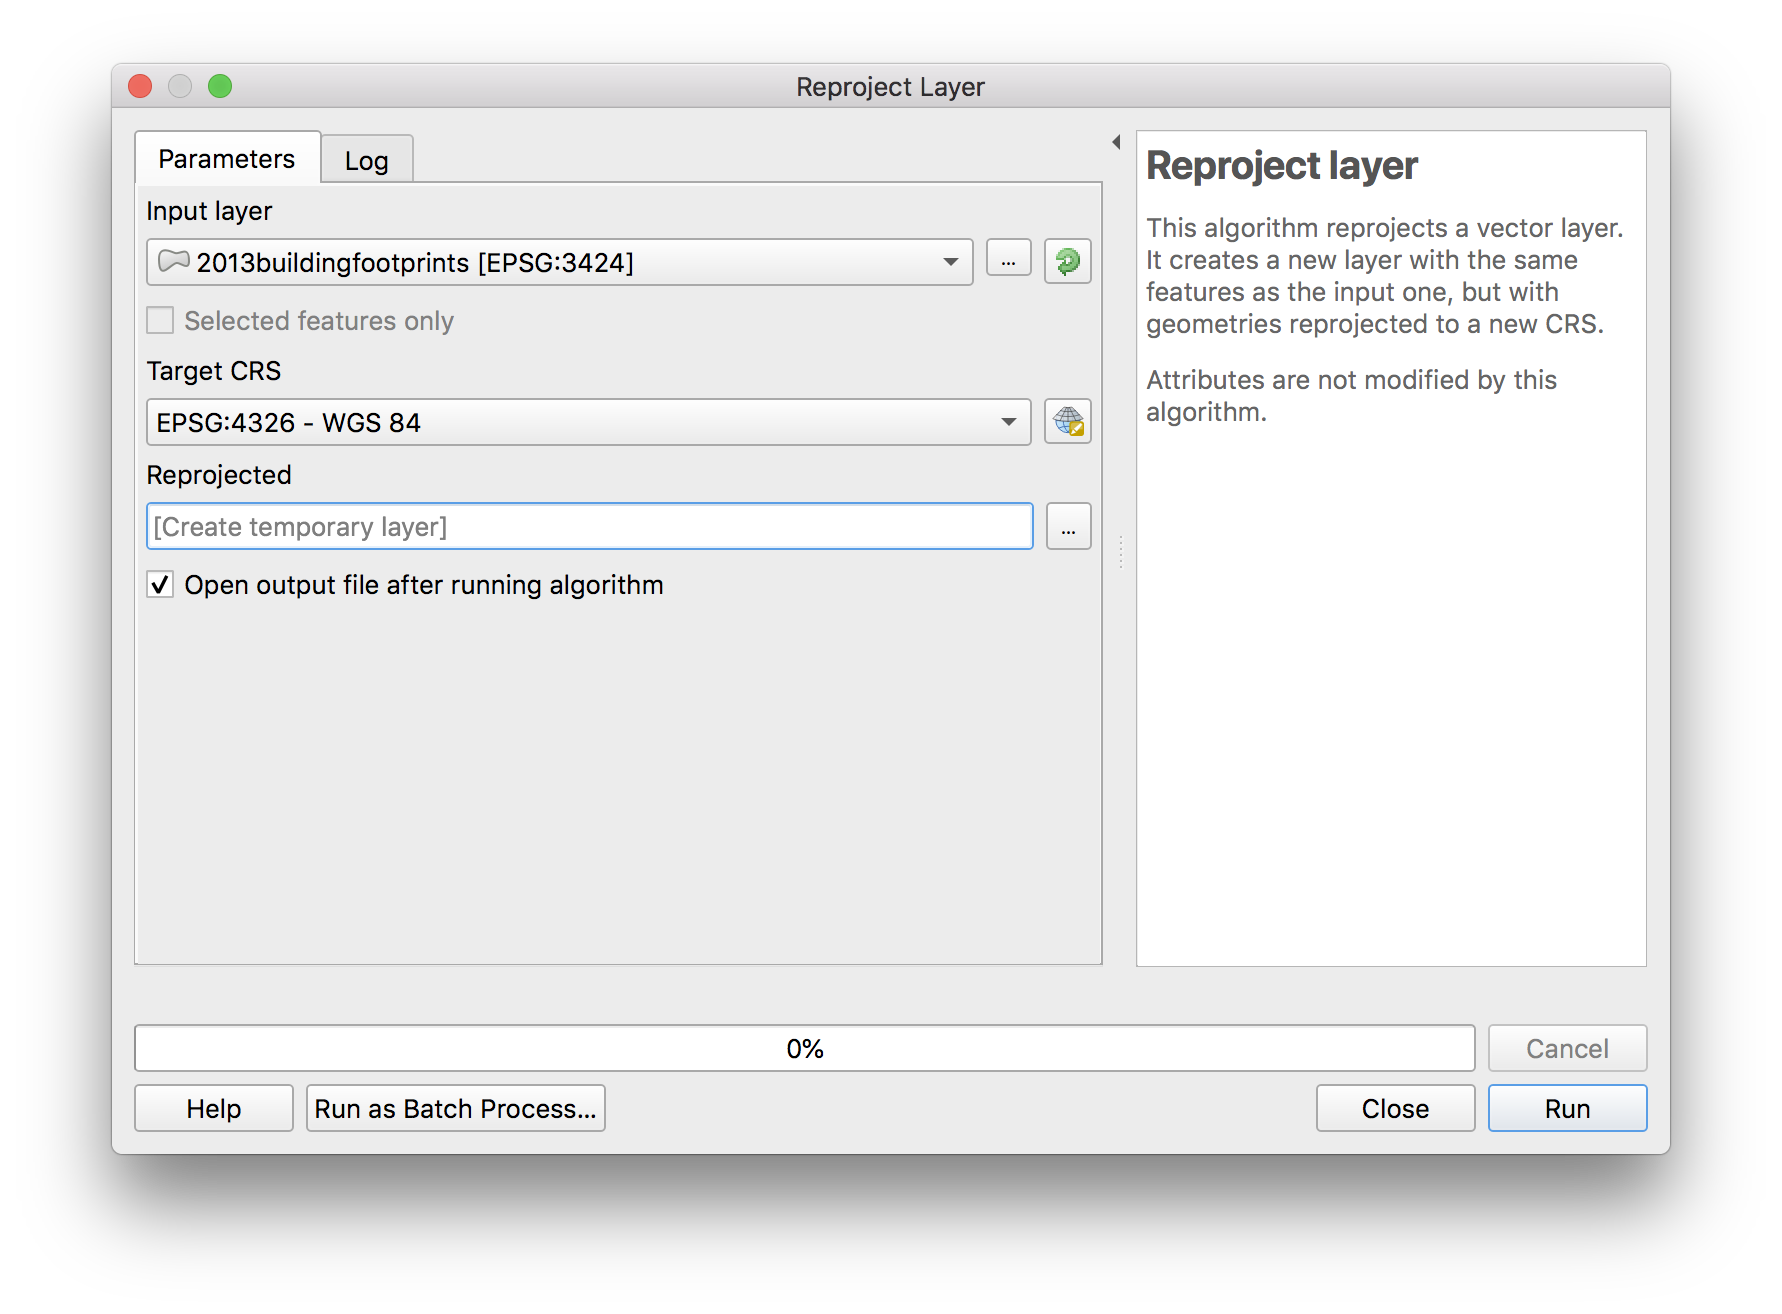
A new temporary layer will be added to your project. Otherwise nothing appears to have changed. Check the CRS for the new layer in the layer properties menu.
To see what this new CRS looks like select the temporary layer and then select CRS>set project crs from layer. The image will be skewed. Zoom out to see the full state of New Jersey
To undo this and return to an appropriate CRS. Using Project>Properties then select the CRS menu and selecting EPSG:3424.
Remove the ‘reprojected’ temporary layer
Note an alternative way to reproject data is to save a new feature layer and when exporting select a different CRS. For an individual layer select export > save features as > and choose a different CRS when exporting.
SAVE your project.
Part 03: Composing a map
This next section walks you through the basic functions and features of the print layout QGIS. The print layout in QGIS allows you to design map layouts for presentation or to export into other formats. Moving from the map canvas to the print layout is primarily a shift from an environment where you can perform analysis and constantly change the map scale (zooming in and out etc) to a set of tools for designing a map at a fixed spatial scale and position, depicting a particular set of features.
For your assignment you will need to turn in a designed map, that imitates the style of one of the USGS topographic series maps. Before you begin this section review the example maps from the USGS. Sample maps are saved in the precedents folder on the course GoogleDrive, and also can be downloaded directly for an area you are interested in from the USGS here.
The next section of the assignment walks you through basic functions and tools to help you accomplish this. However there are many features that will not be covered – feel free to explore the QGIS docs for a full list and explanation of the tools and features available.
Lets begin.
Click the New print layout button in the top tool bar to open a new print layout. In each QGIS project you can have multiple different layouts. Give a name to the layout you are creating.
Setting paper size
Right click any where on the page that opens, and then select Page Properties from the menu that opens.
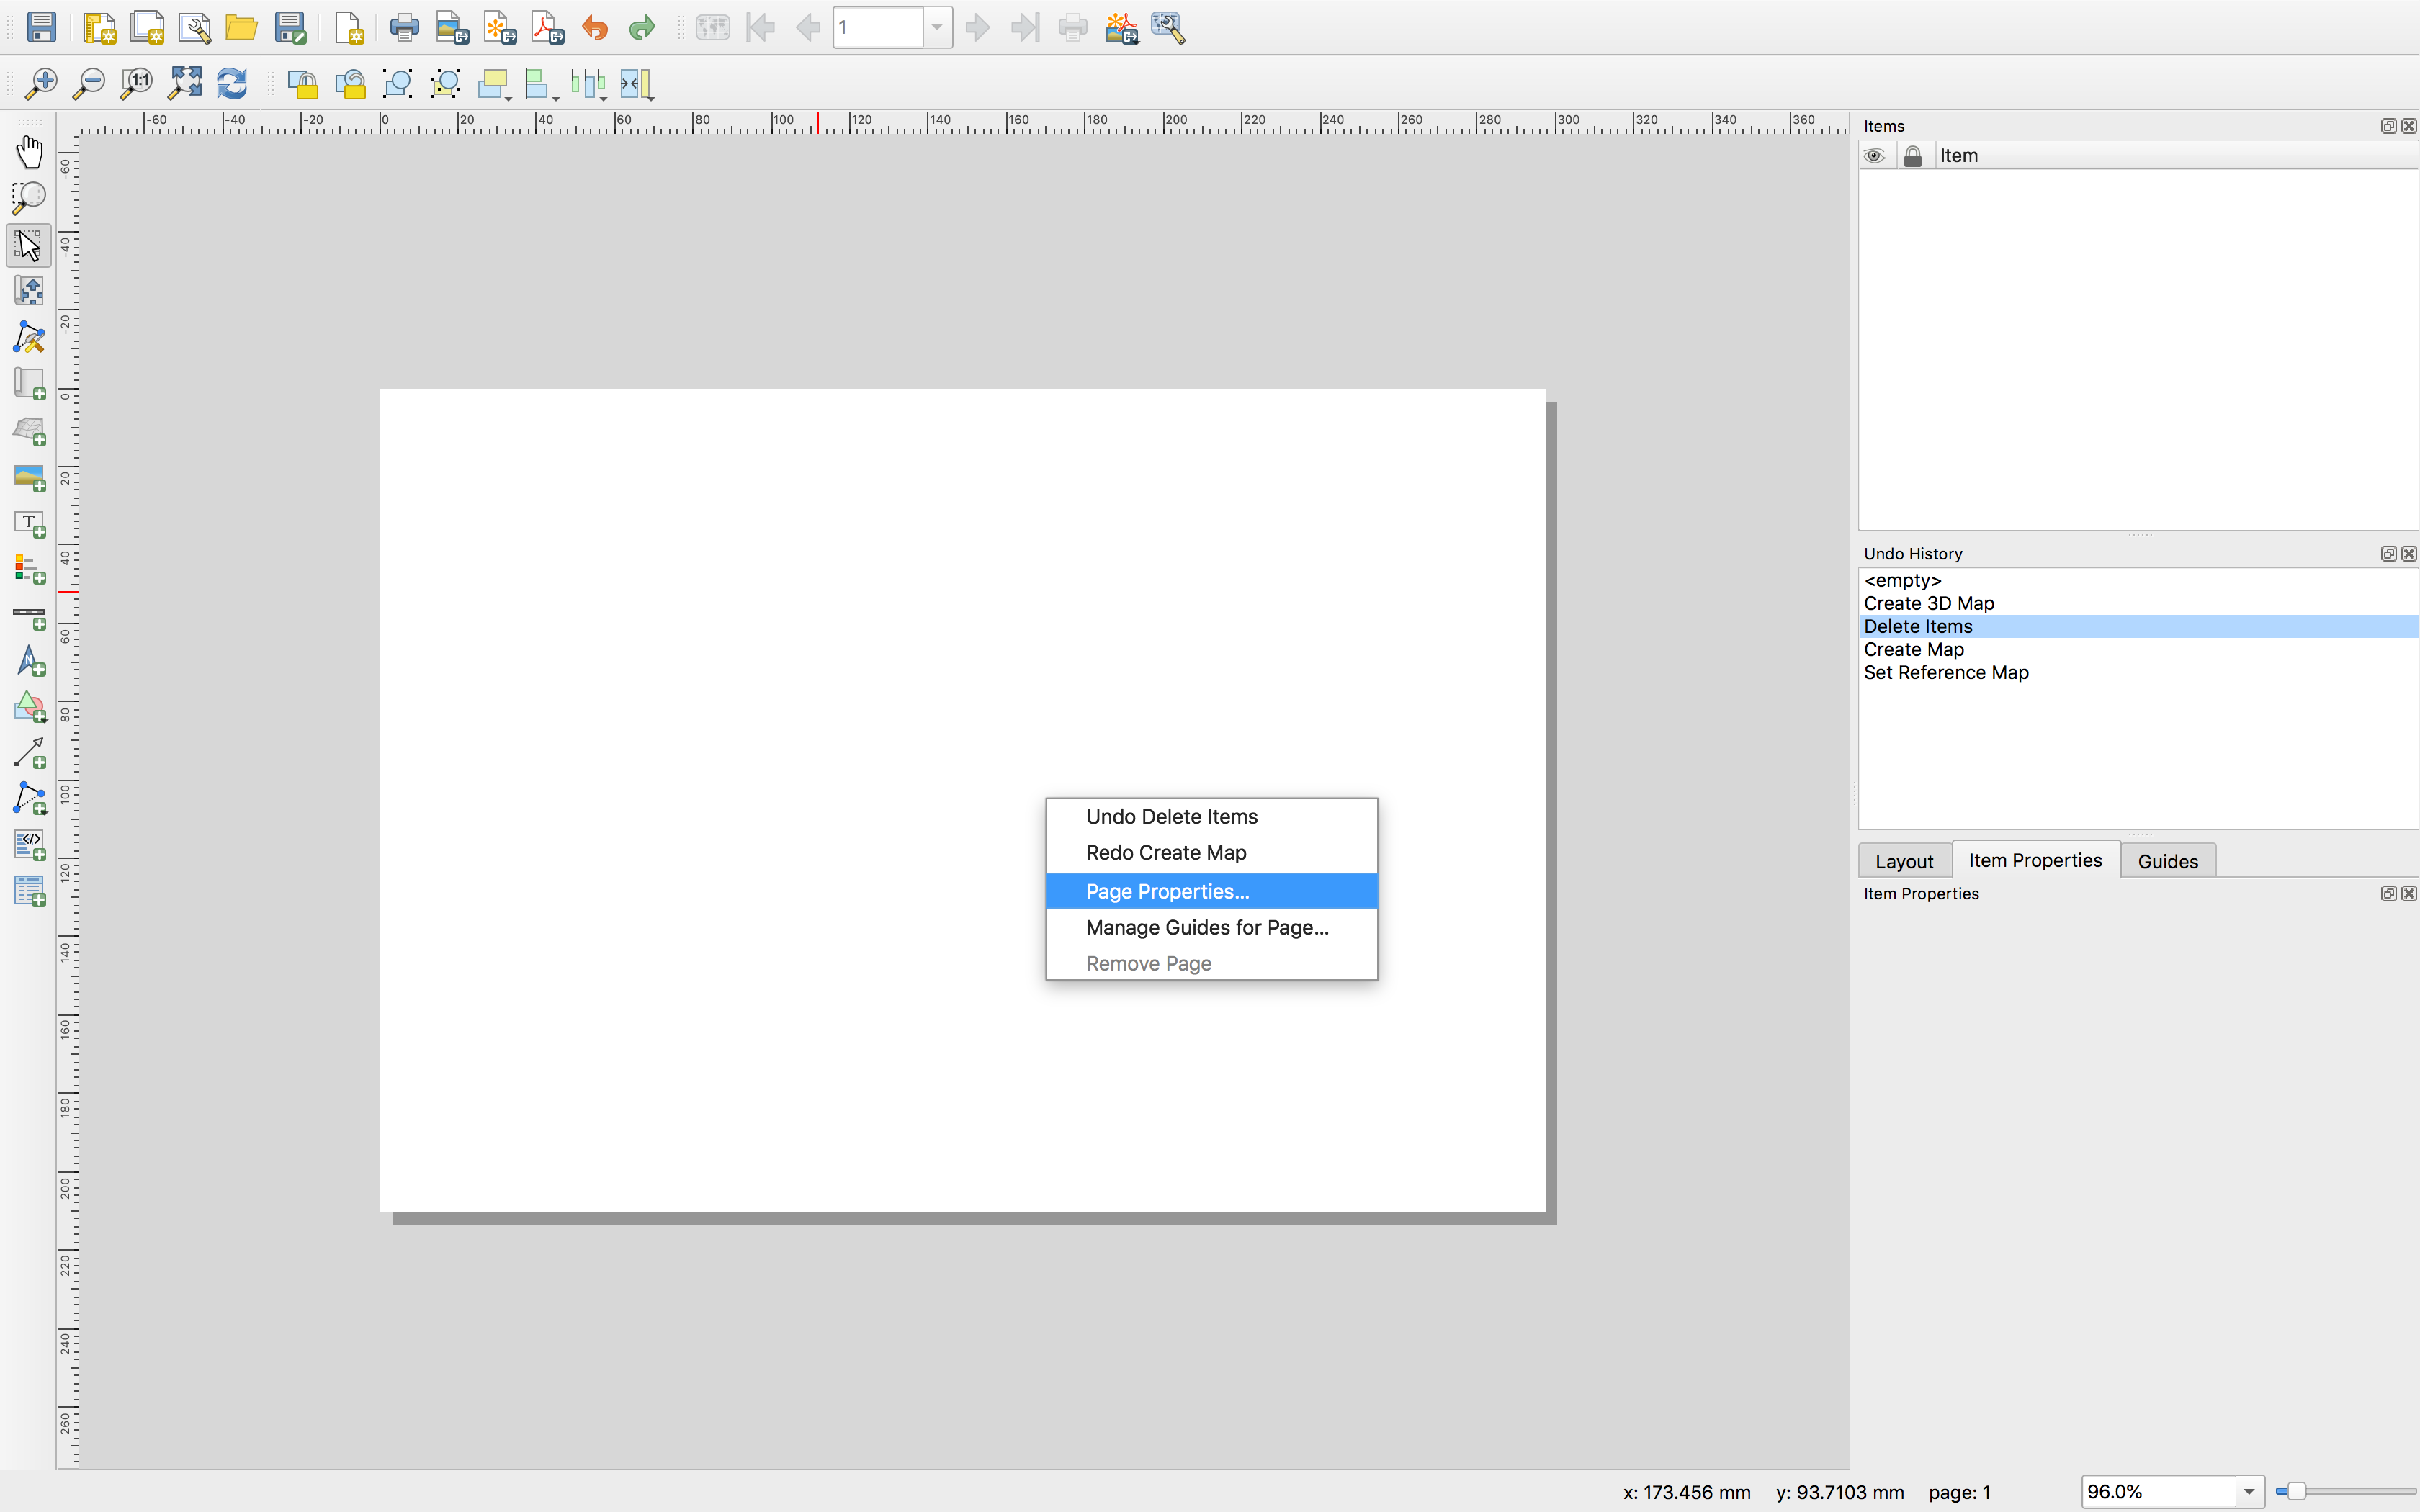
In the item properties panel set the page size as shown below (22”X27” is one of the standard sizes for USGS maps).
Adding a map to the layout
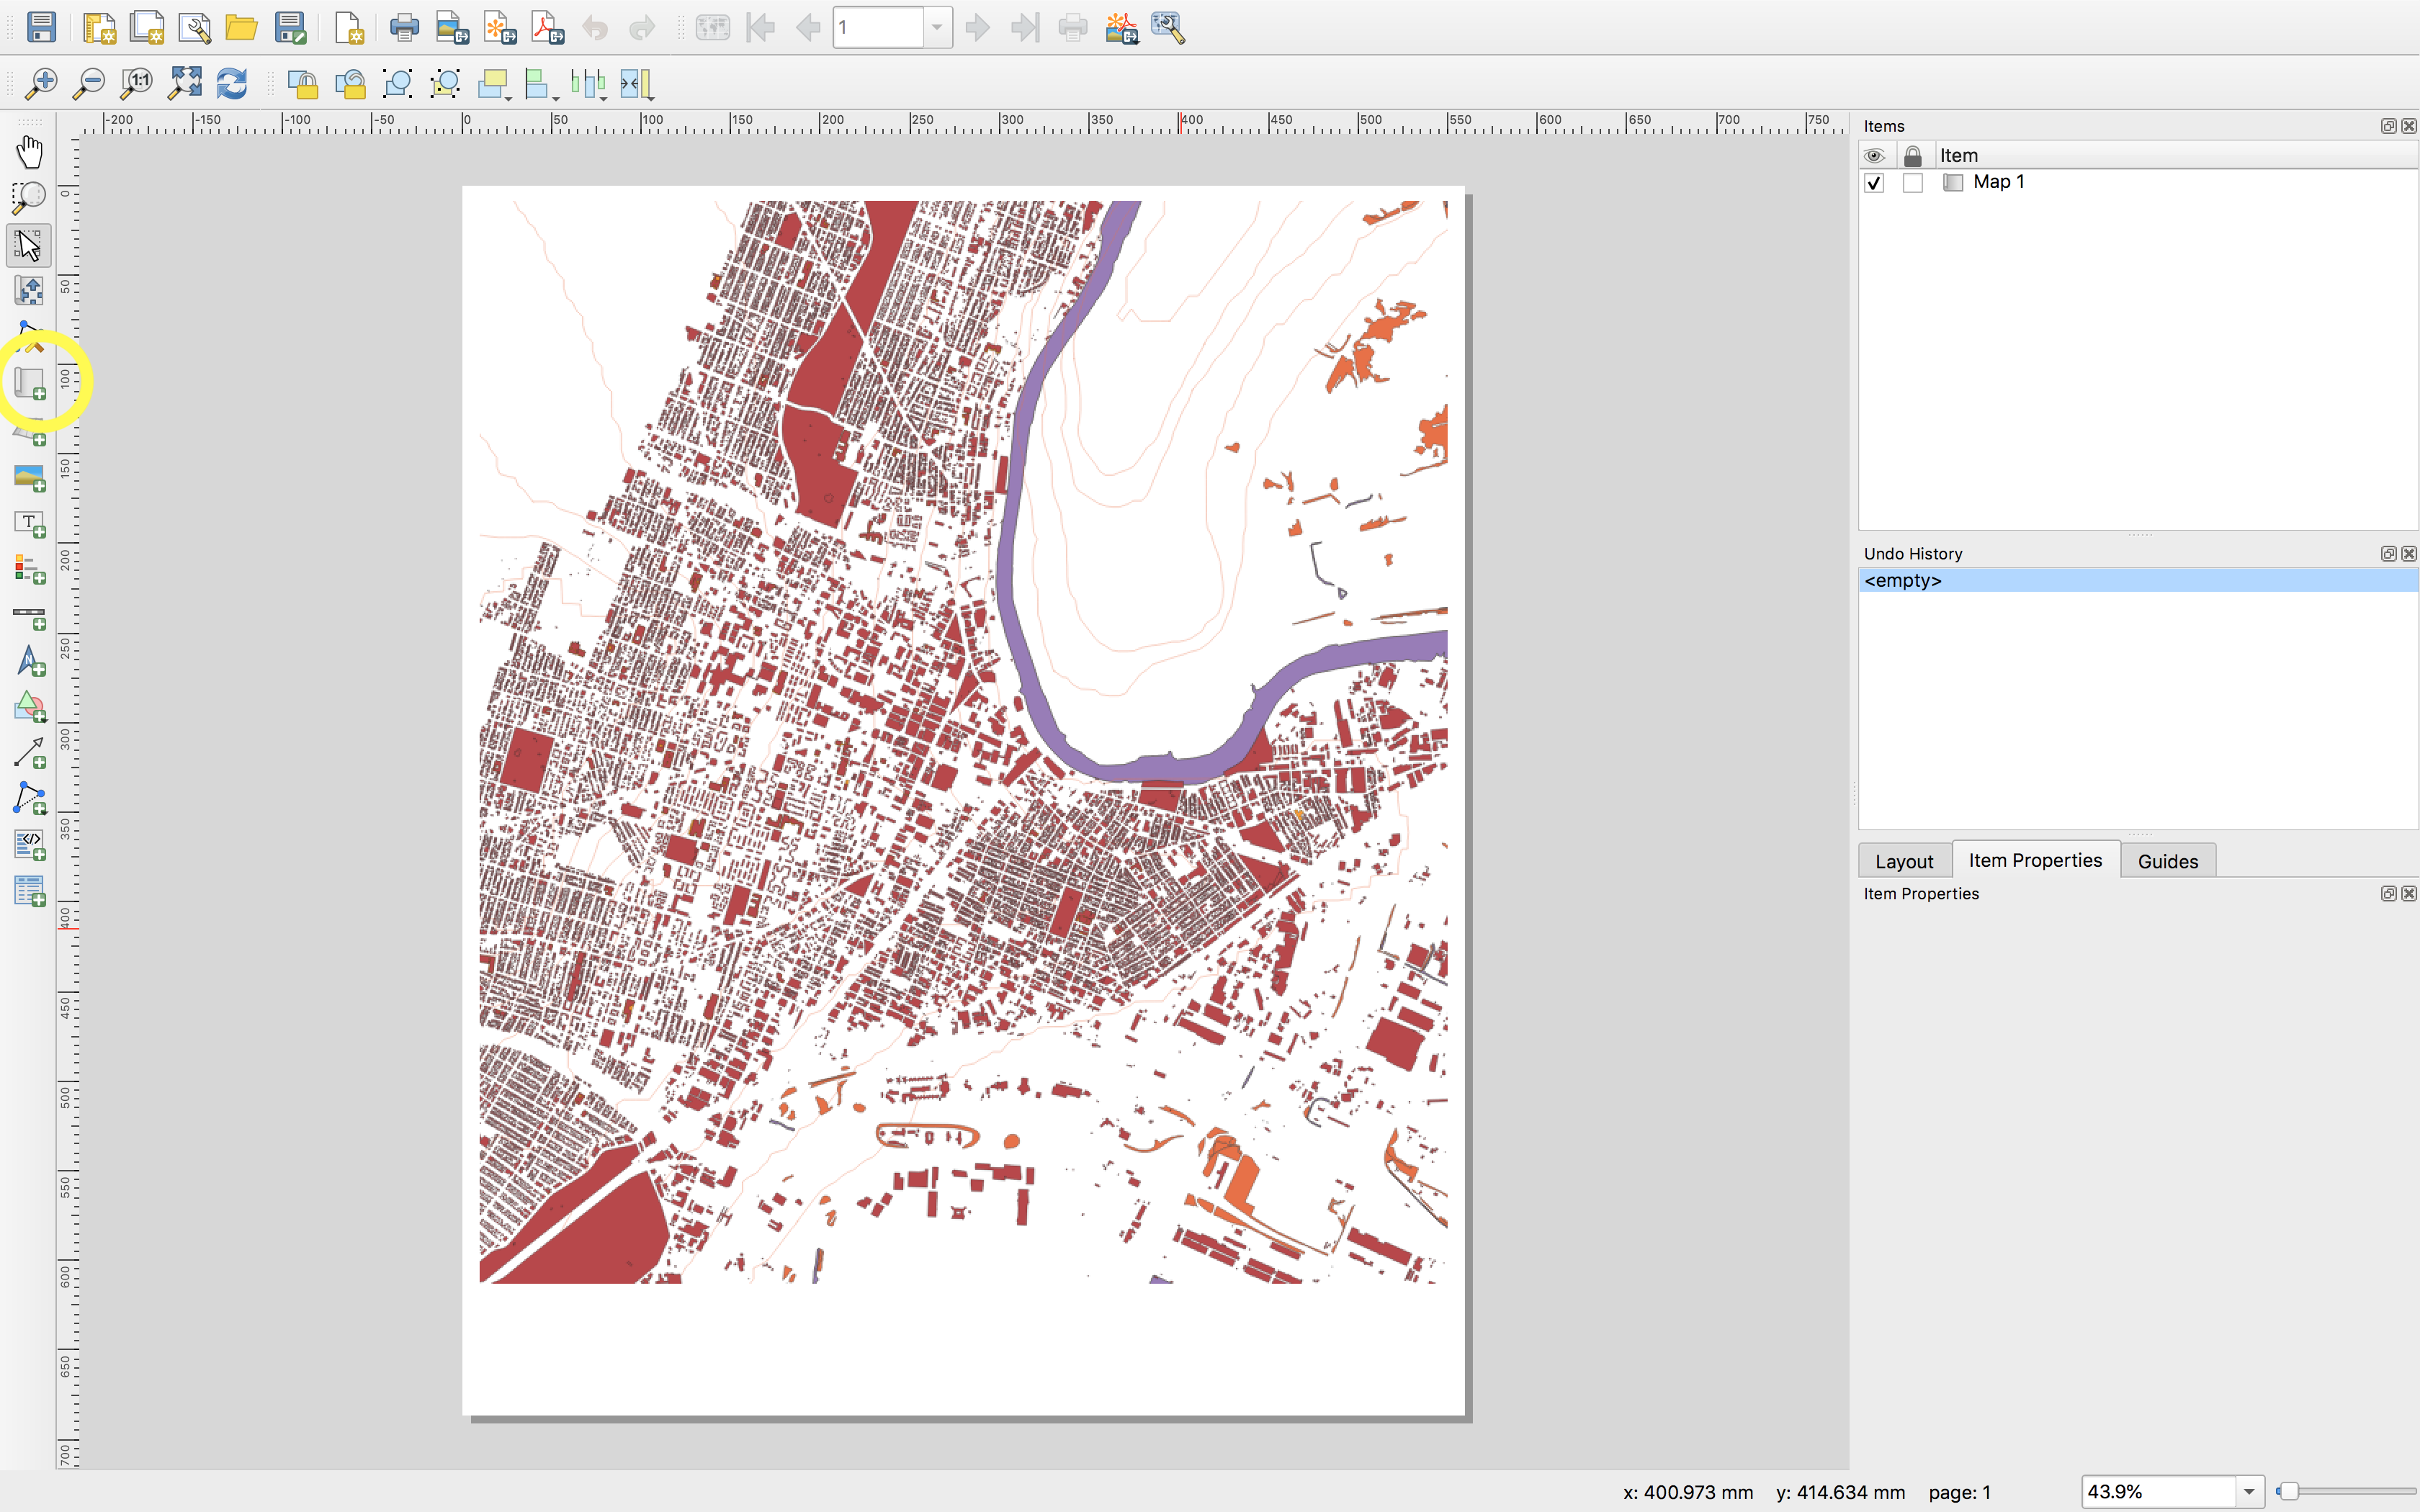
Use the add map tool and then click and drag to create a rectangular map frame. The map visible in the map canvas will appear.
Note you can have multiple maps in a single layout. For example you can have a key map depicting the location of your main map in a broader geographic context; or you can have a detail map showing one area at a higher spatial resolution.
SAVE your project.
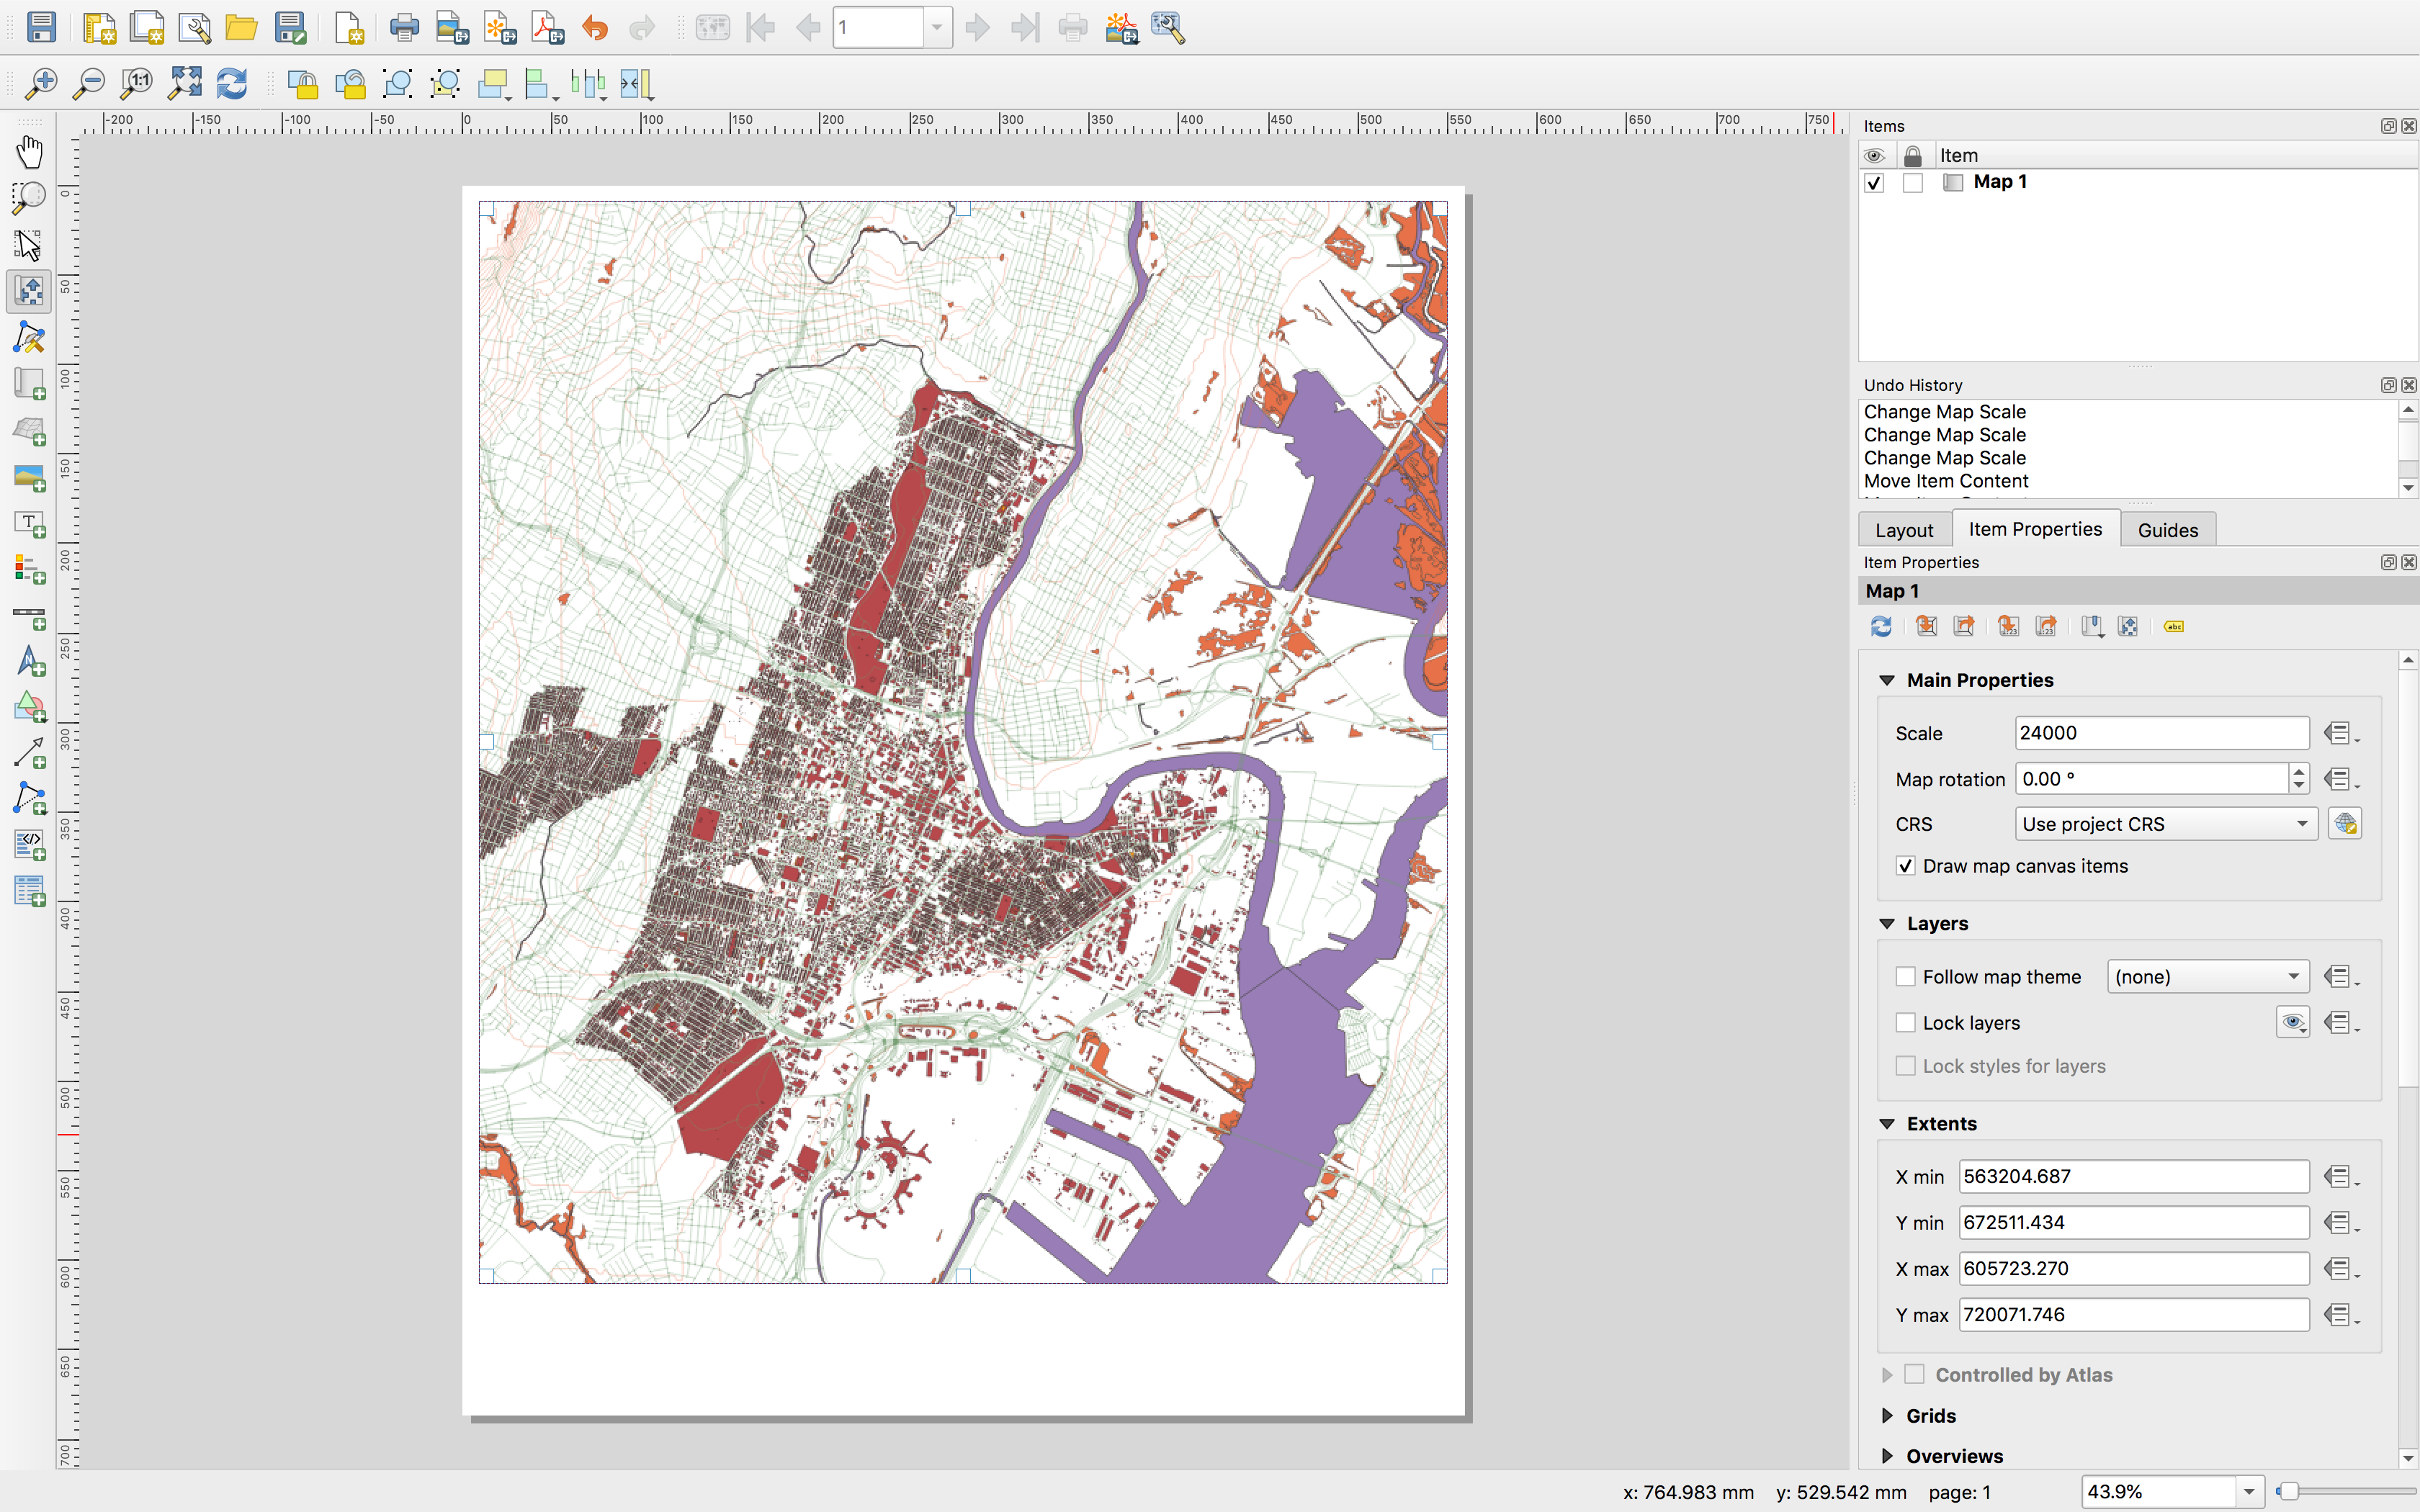
Defining the map scale and extents
The map you are designing in the print layout will have a set spatial scale, and spatial extents. You can set these in the Item properties for each map in your layout. The map below is set at a scale of 1:24000, the same as the largest scale USGS Topographic Series maps.
Note: the extents will always be listed in the units of the coordinate reference system set for the map canvas, and will be specified relative to the meridians of that coordinate reference system.
If you plan to use the print layout primarily to export maps to be edited further in a different layout or graphics program then it is good practice to write down the scale and extents exactly so that you can export multiple versions of your map and have and easy time aligning the elements of your map.
Adding standard map elements: scale, legend, north arrow
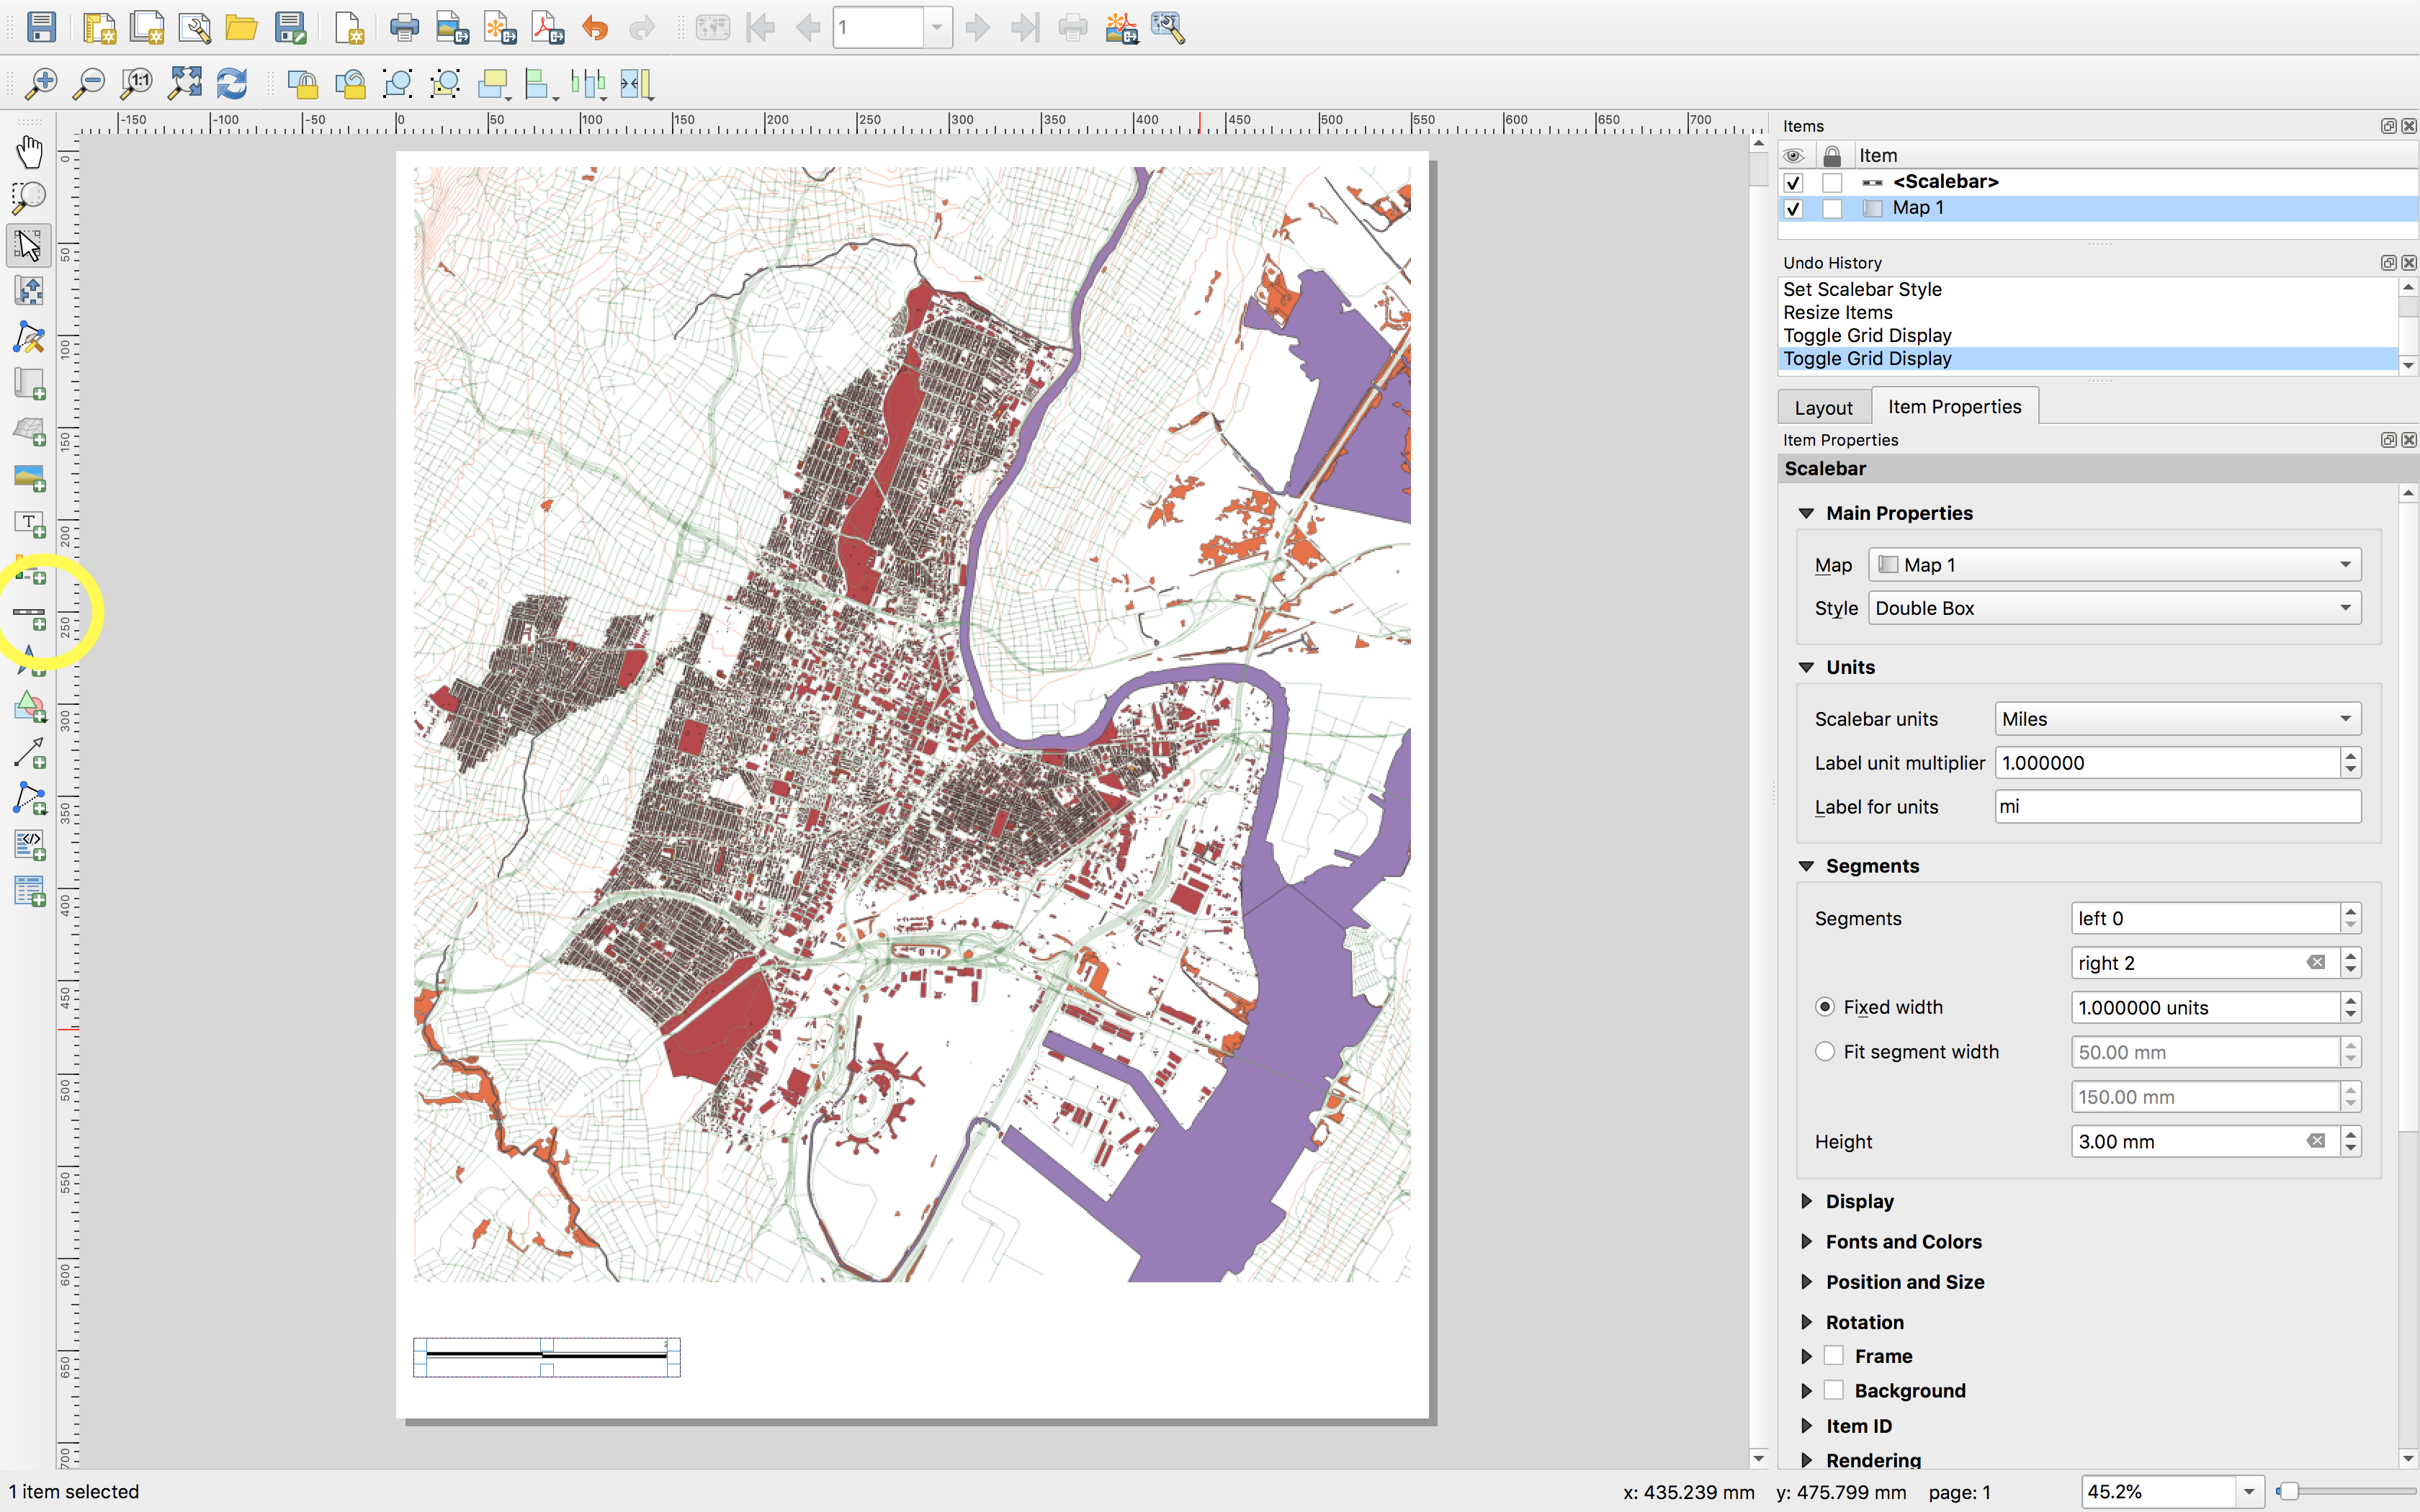
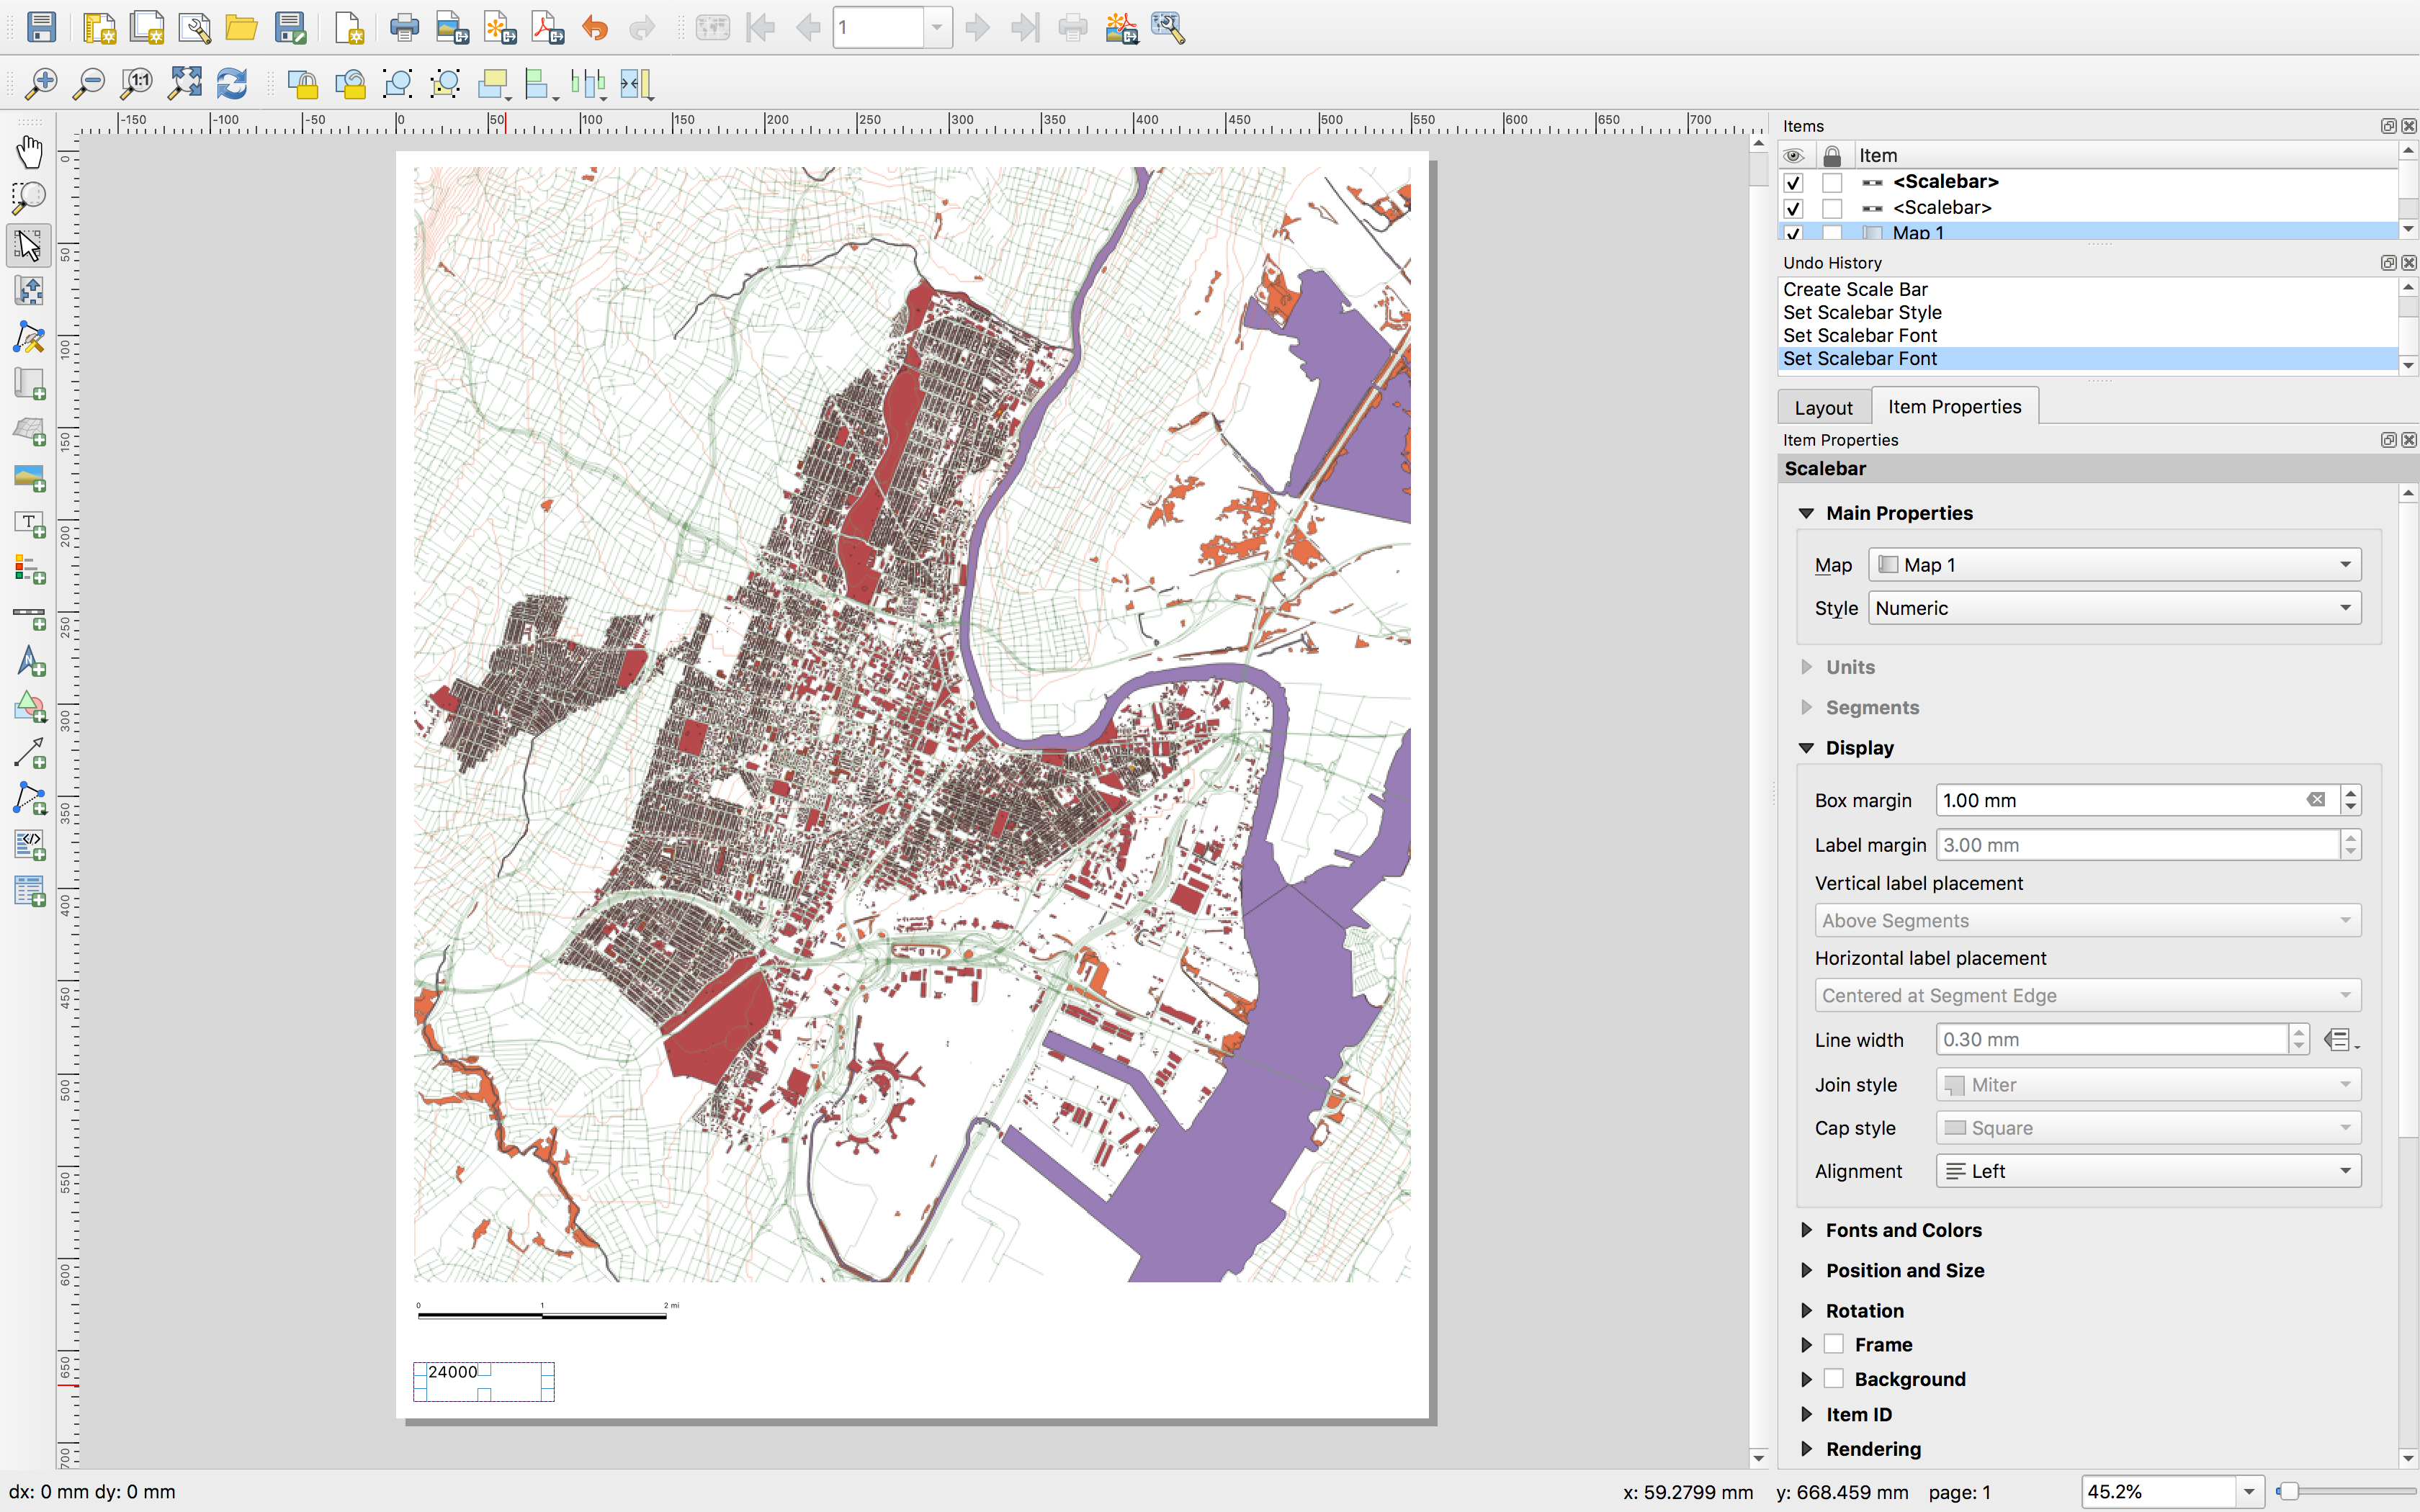
To add a graphic or text scale bar select the Add scale bar tool and adjust the options as you see fit. The scale bar is always tied to a specific map in your layout (seen below in the Item properties the added scale bar references Map 1) and if you adjust the scale of that map the scale bar will adjust accordingly.
Graphic:
Text:
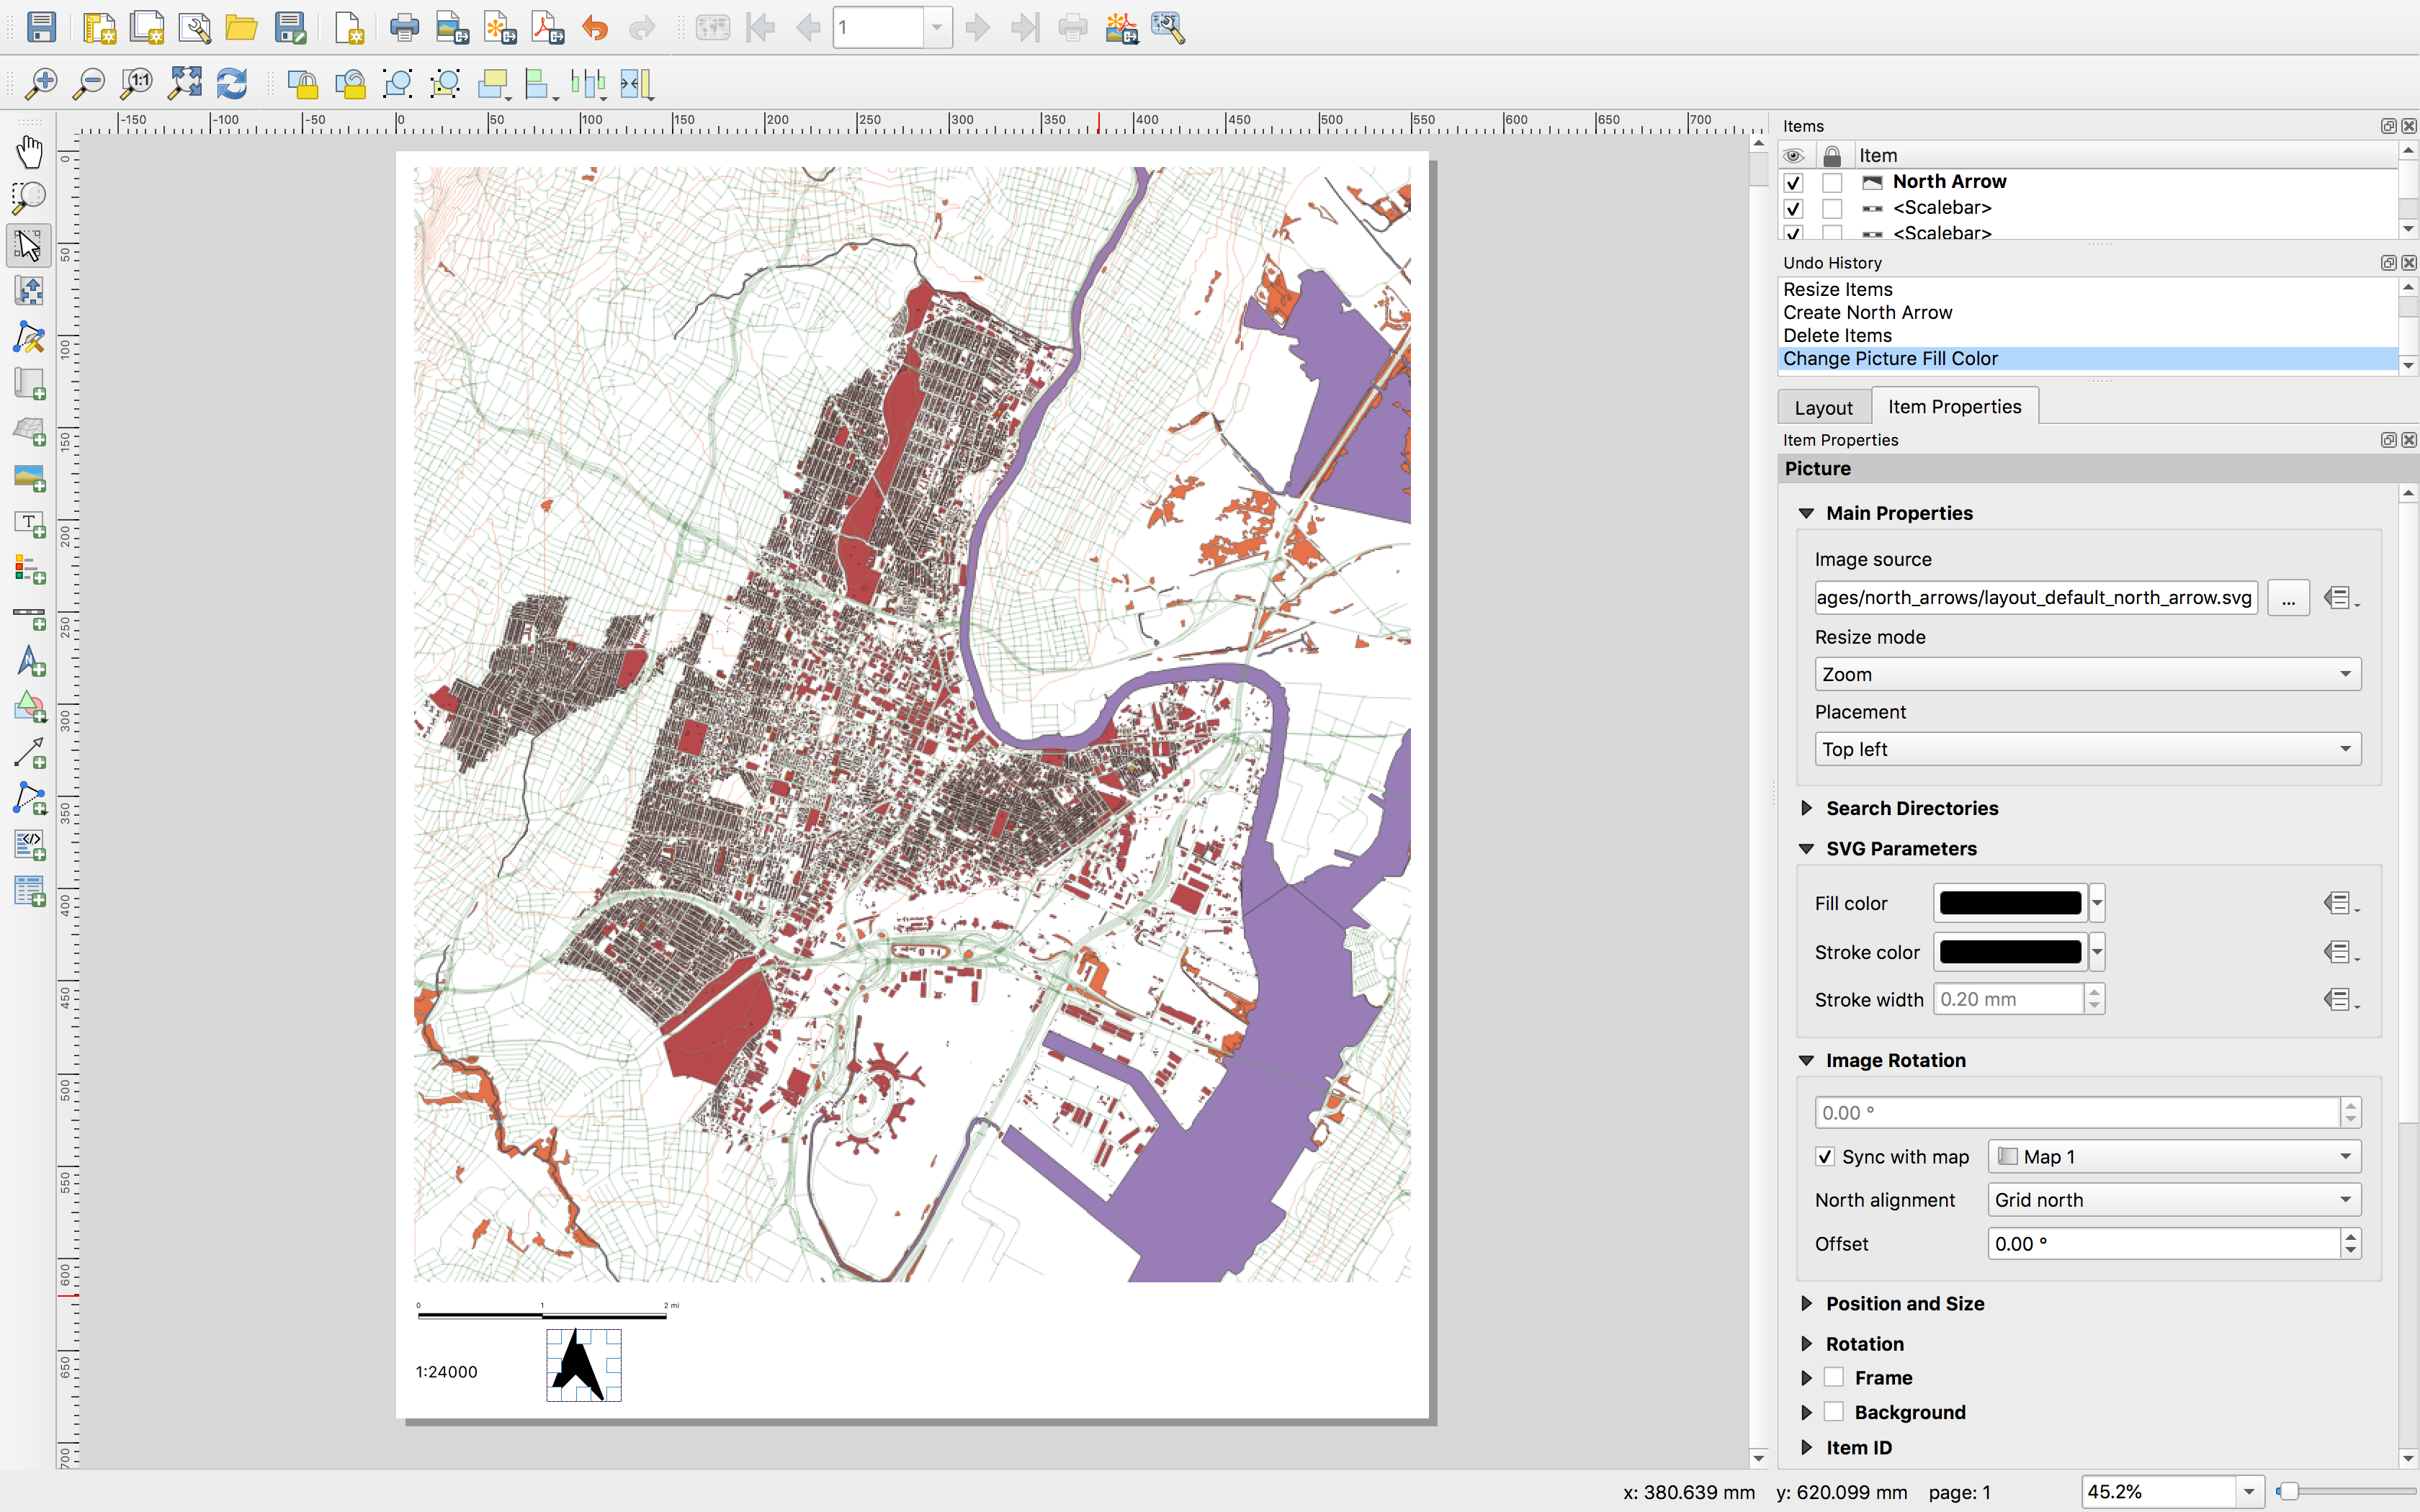
A north arrow can be added in a similar fashion.
SAVE your project.
As can a legend:
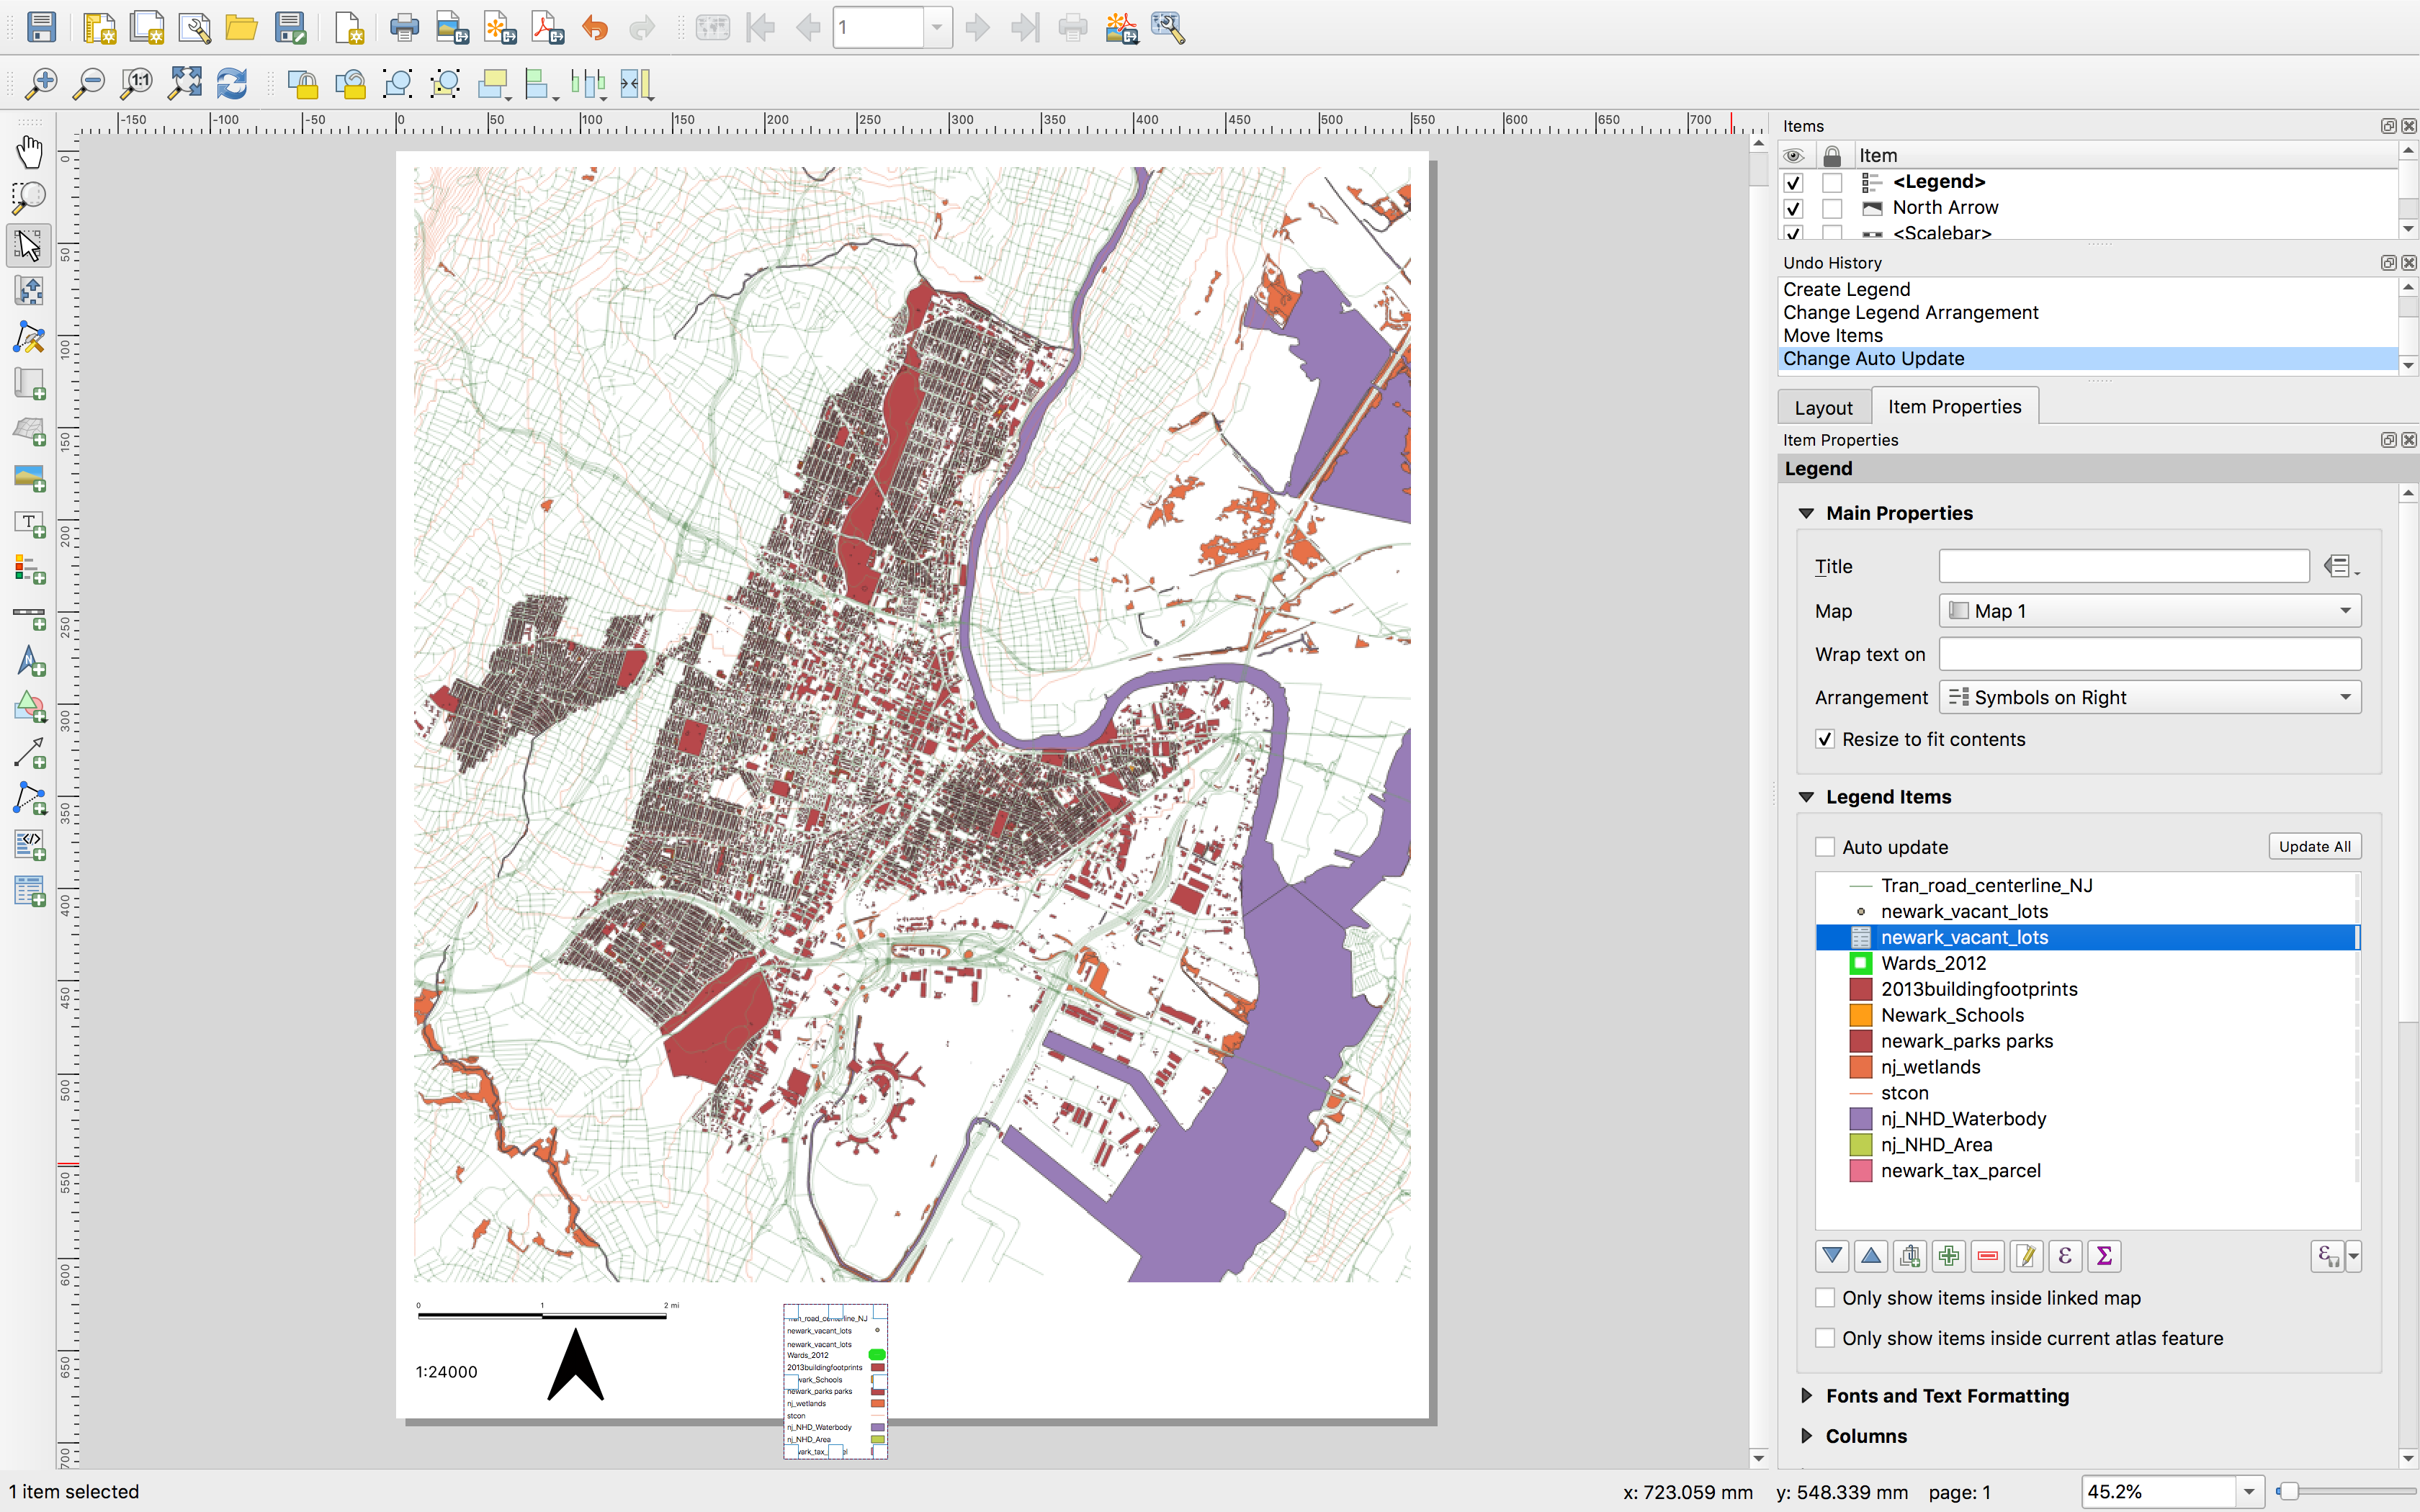
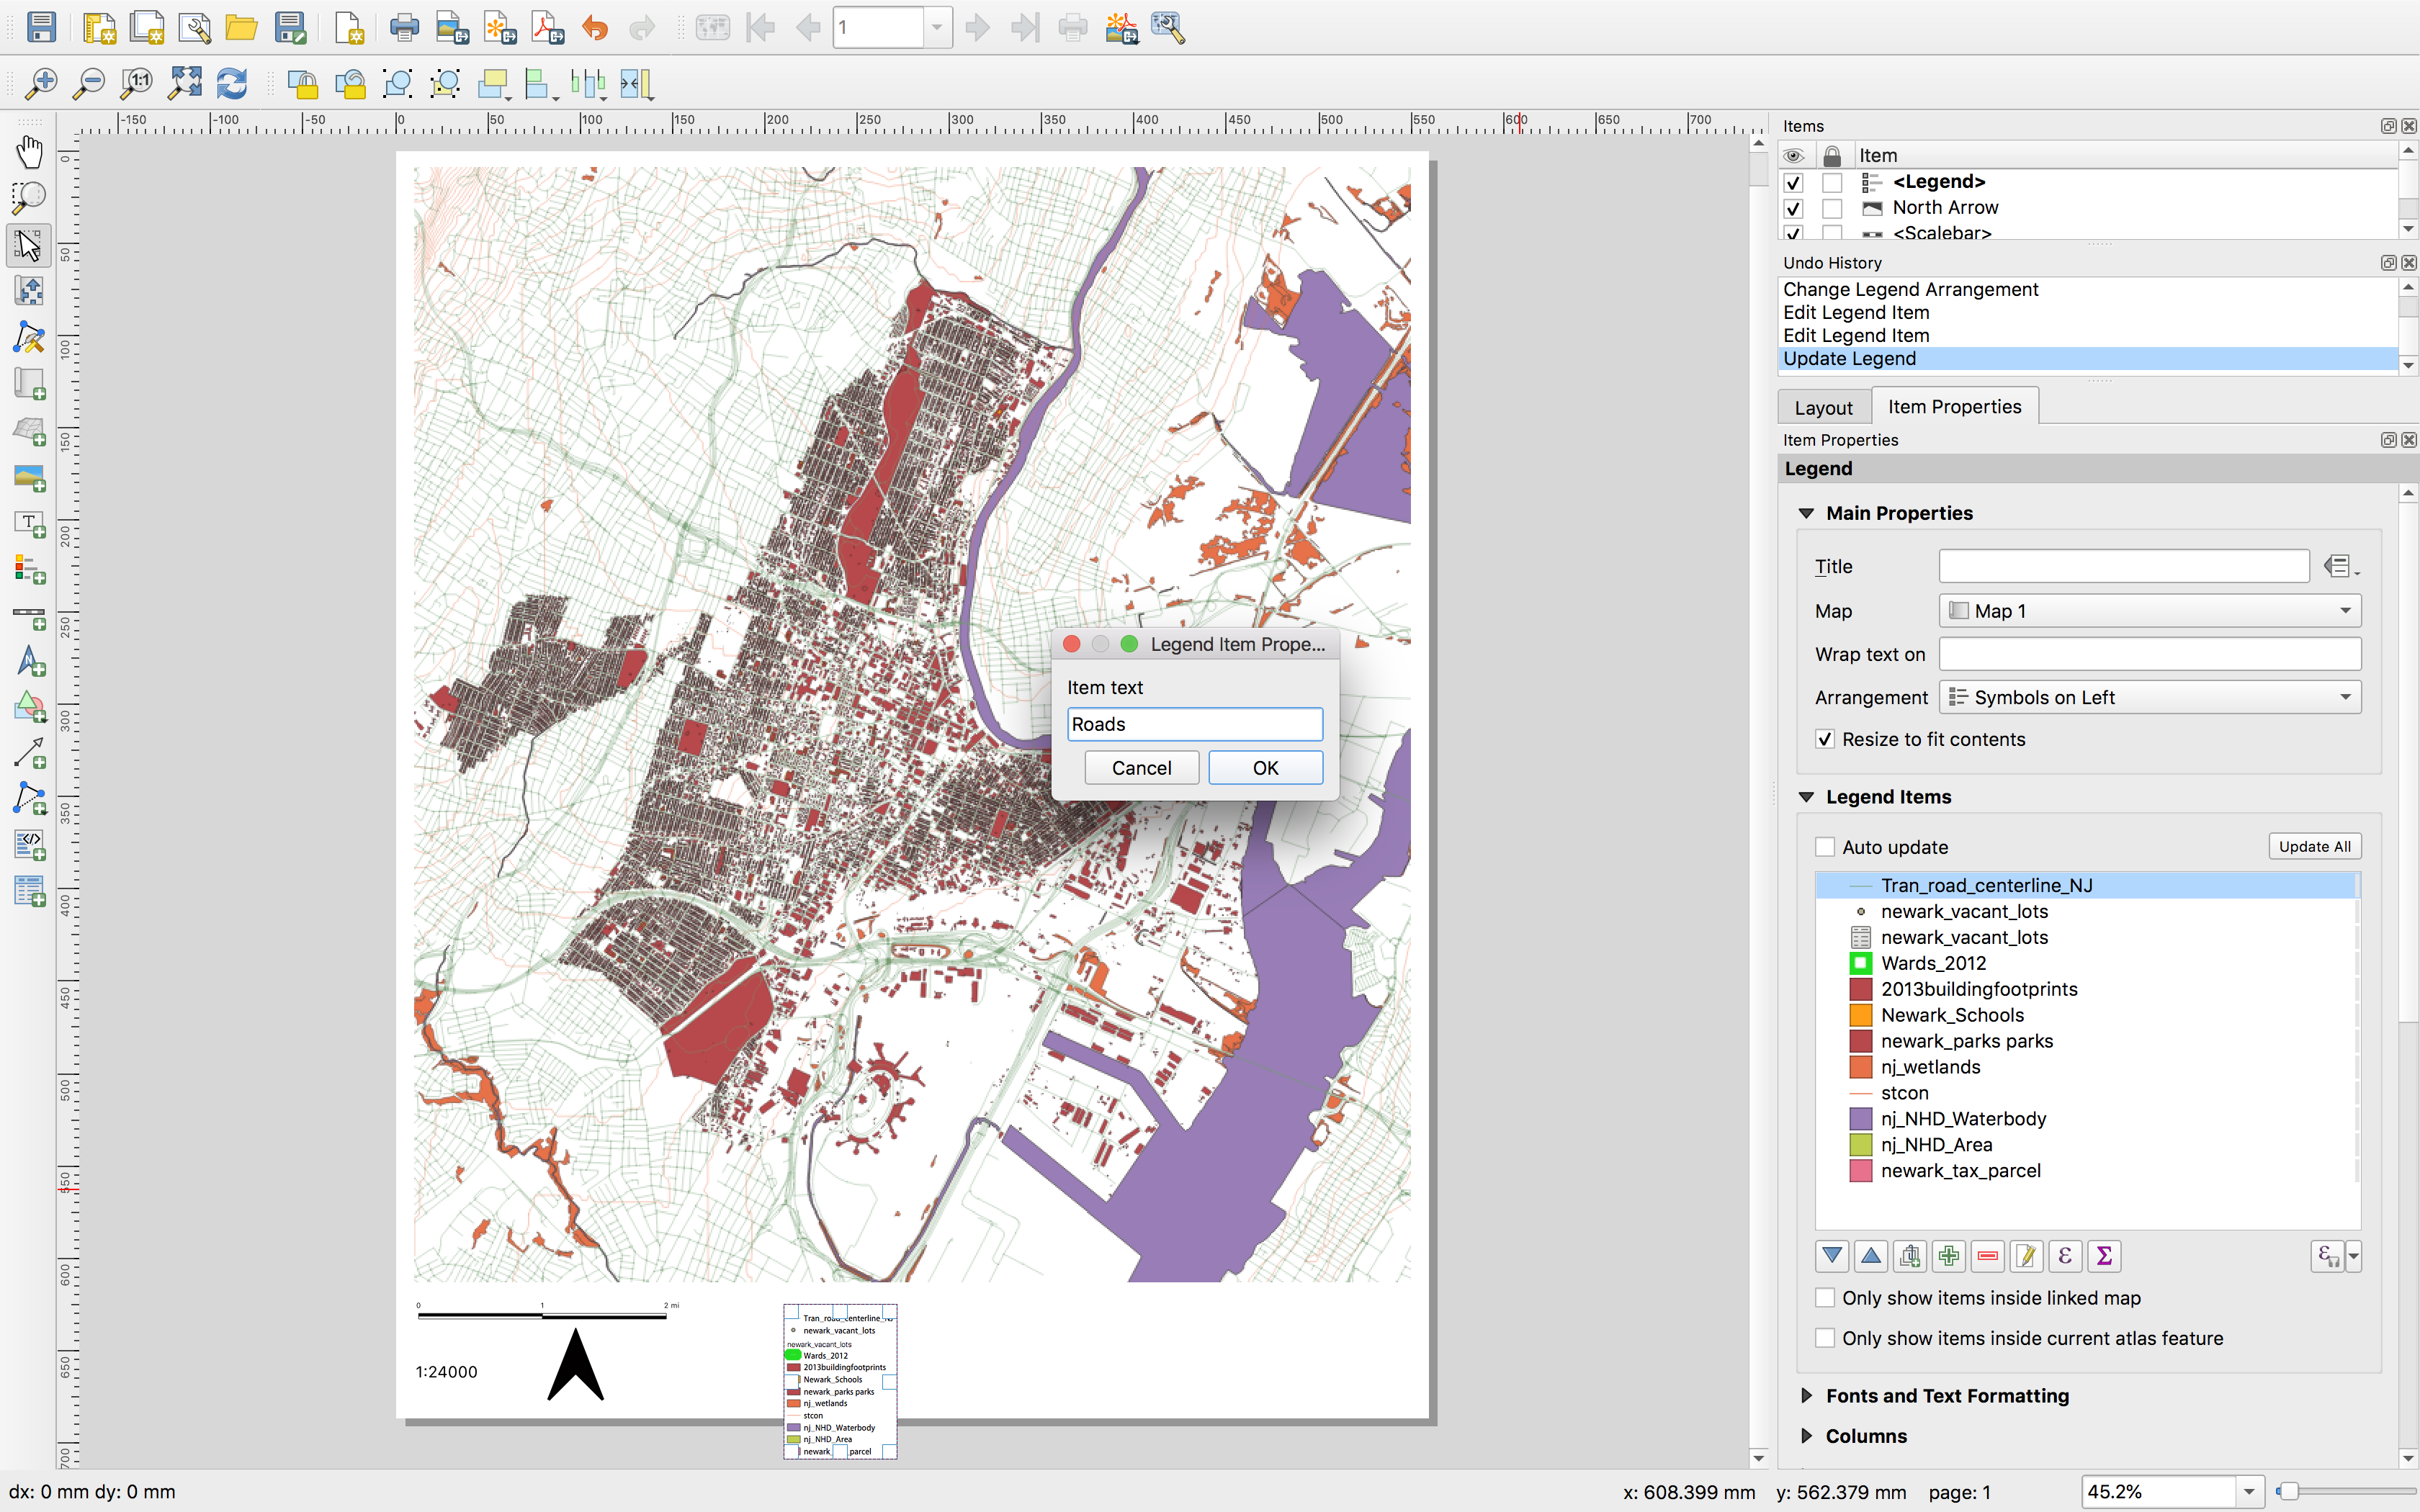
The default legend includes the names of each layer exactly as they appear in the layers panel. These can be manually adjusted. The font and text size for all legend elements can also be adjusted in the Item properties menu for the legend.
SAVE your project.
Adding a grid
A grid can help to convey the location of a map within a given coordinate reference system. A map grid displays vertical and horizontal lines at defined intervals of given coordinate reference system. A graticule refers specifically to the display of geographic coordinates (degrees of latitude and longitude).
A map can have multiple grids and/or a graticule to convey the location of the map across multiple coordinate reference systems. Here we will add a grid for the coordinate reference system of our map (New Jersey’s State Plane NAD 1983) as well as a graticule.
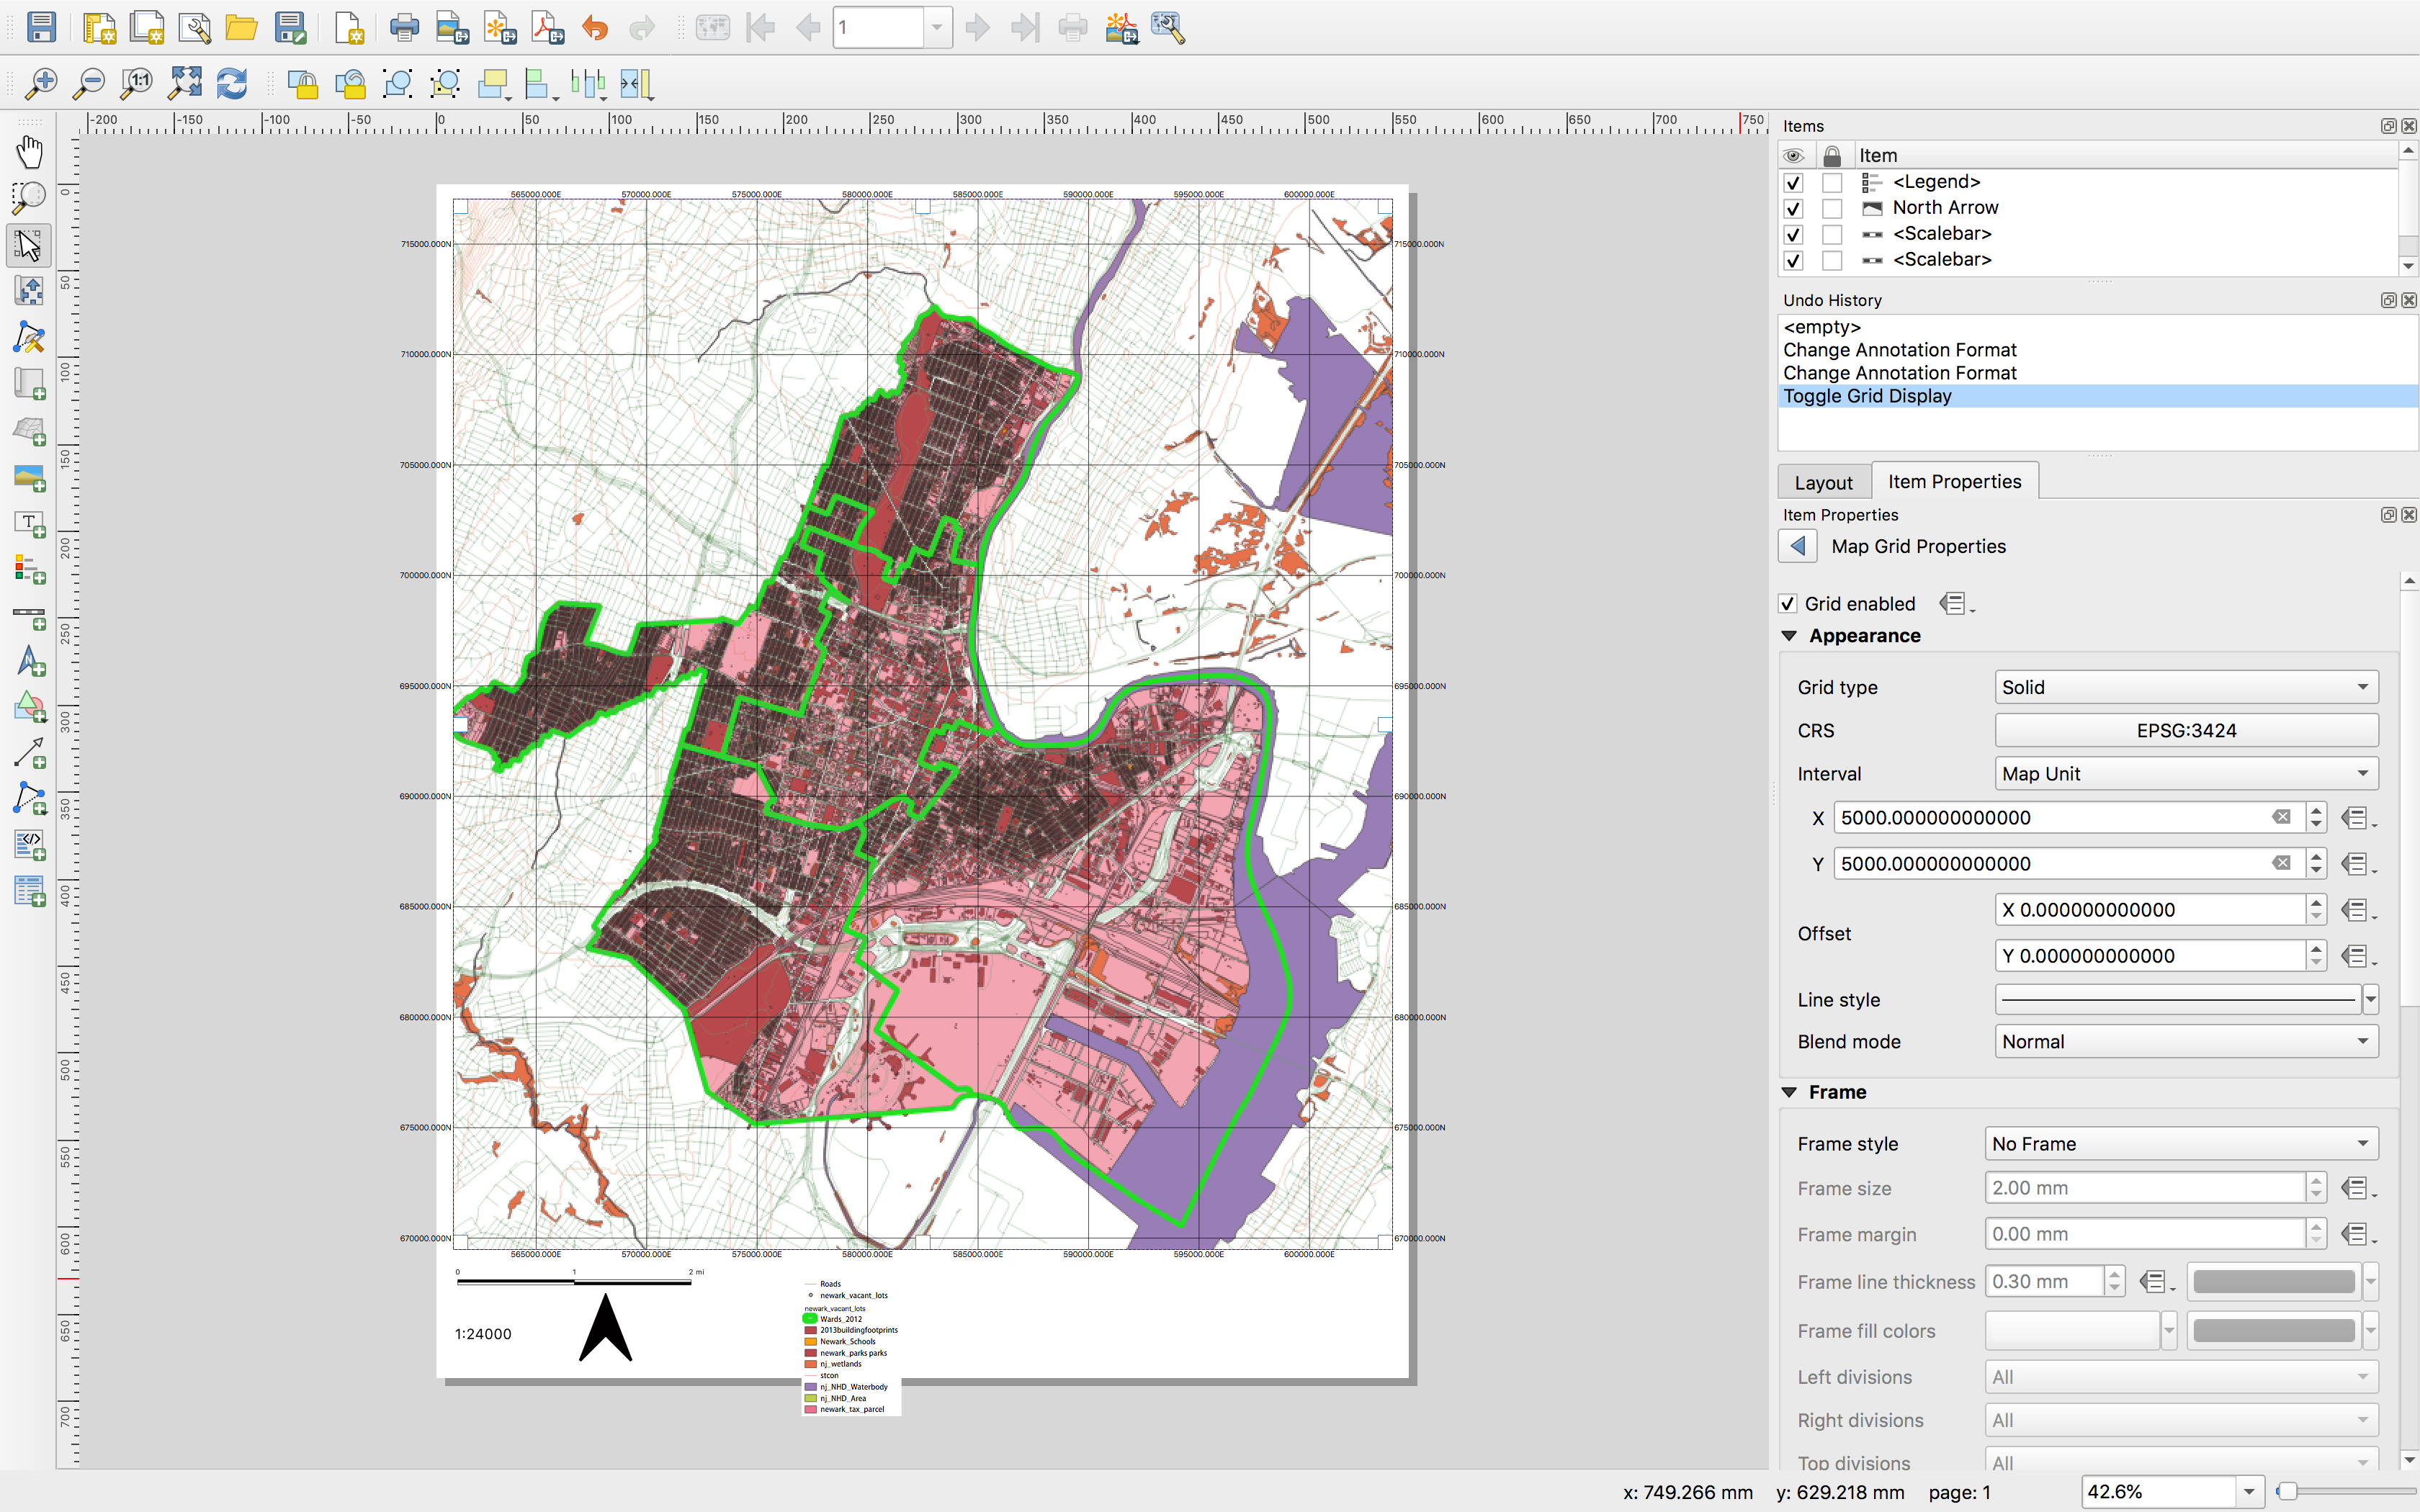
Select the map and view its item properties. Scroll to and expand the Grids section. Use the green + to add a new grid. Name the grid EPSG 3424 (the CRS of the map).
Select modify the grid. And make the following selections: for CRS EPSG: 3424; interval map unit; x 5000 y 5000. Scroll down to Draw coordinates. Select the check box. For format select decimal. Then leave the grid item properties menu with the blue arrow at the top of the properties menu. \
The map now displays a grid showing the coordinate reference system.
Next create a graticule to overlay on the map. Create a new grid as before. Name it WGS84 (this is a geographic coordinate reference system). Select modify grid make the following selections: CRS EPSG: 4326; interval map unit; x & y as 0.03/
So that you can distinguish with the other grid change the color by selecting the Line dropdown menu. Scroll to enable Draw Coordinates. Format as degree, minute. Change the font color to match the color you chose for the lines
Note: Grid enabled at the top of the grid properties menu toggles visibility for the grid.
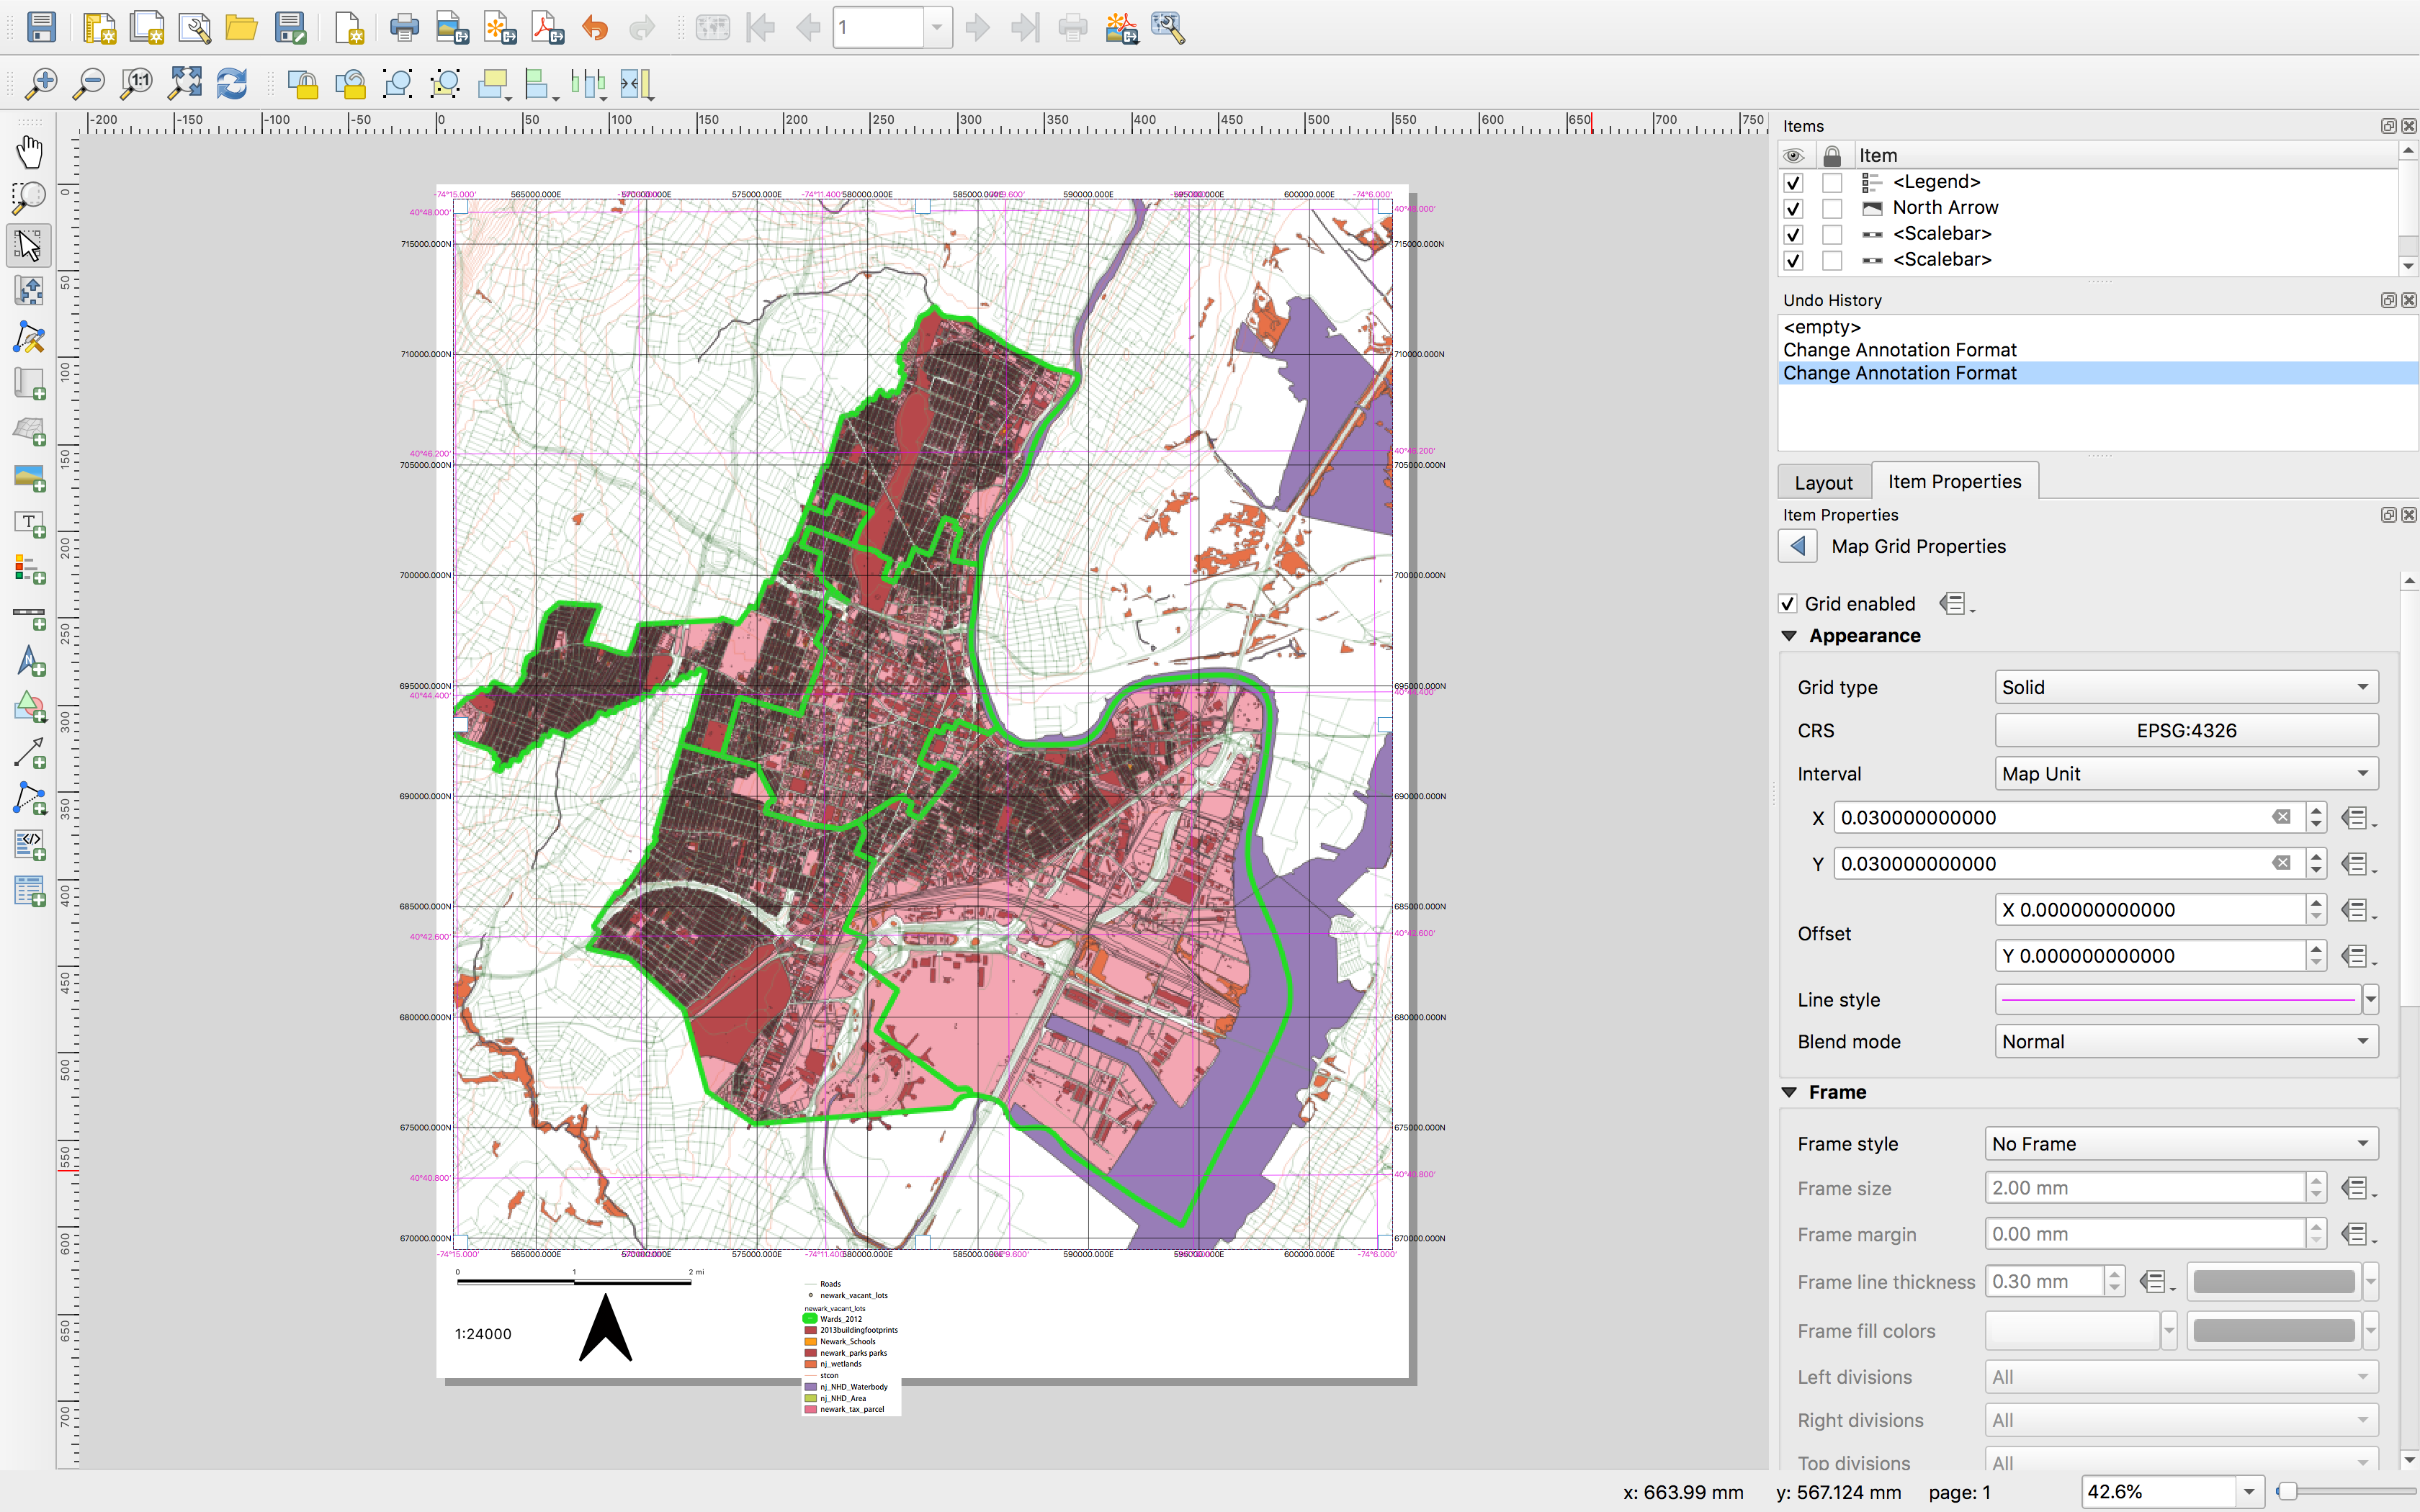
Notice difference between the grid and the graticule. Based on our discussion of projections can you interpret these differences? Describe what you see and why the two grids are different, you will be required to turn this in
SAVE your project.
Design your map
At this point in the assignment you may either (A) export your map and continue to design it in the software program of your choice (Illustrator is a good option) or (B) use the layer symbology menus for the layers in your map project to modify and design your map. Skip to the appropriate section here based on your choice.
A. export map and work in a graphics editing program
Adjust the placement of your map within the map window so that has the extents and scale you would like for your final map.
Make note of the extents for your map window (write these down in case you need to reexport a layer later this way your export will be perfectly aligned)
Export your print composer as an SVG.
 Continue to edit and design your map in Adobe Illustrator or another graphics editing software.
B. continue to edit using QGIS
Return to your QGIS project, and edit the layer symbology using the menu within the layer properties panel for each layer
Return to the print composer use the refresh view button to view the changes you just made to the map within the print composer
